U.S. Fed balance sheet grows to $4 trillion (Reuters) - The U.S. Federal Reserve's balance sheet reached $4 trillion in the latest week as its latest stimulus program aimed to help the economy added more Treasuries and mortgage-backed securities to its holdings, central bank data released on Thursday showed. On January 15, the Fed's liabilities, which are a broad gauge of its lending to the financial system, rose to $4.029 trillion from $3.986 trillion a week earlier. The Fed's third round of quantitative easing began in late 2011 when its balance sheet was less than $3 trillion. On December 18, the central bank decided to shrink its monthly purchases of Treasuries and MBS by $10 billion to $75 billion in January. The Fed's holdings of Treasuries rose to $2.221 trillion as of Wednesday, up from $2.213 trillion the previous week. The Fed's ownership of mortgage bonds guaranteed by Fannie Mae (FNMA.OB), Freddie Mac (FMCC.OB) and the Government National Mortgage Association (Ginnie Mae) jumped to $1.525 trillion from $1.490 trillion a week ago. The Fed's holdings of debt issued by Fannie Mae, Freddie Mac and the Federal Home Loan Bank system totaled $54.911 billion from $55.657 billion the previous week. The Fed's overnight direct loans to credit-worthy banks via its discount window averaged $3 million a day during the week, slower than $12 million a day the previous week.
FRB: H.4.1 Release-- Factors Affecting Reserve Balances -- Thursday, January 16, 2014: Federal Reserve Statistical Release, Factors Affecting Reserve Balances of Depository Institutions and Condition Statement of Federal Reserve Banks
Weak US jobs data challenge the Fed - Among the bedrock assumptions for 2014 among macro-economists, two are central: first, that the real GDP growth rate in the US will accelerate as the fiscal squeeze abates, and, second, that the Federal Reserve is now on “auto pilot”, and will taper its asset purchases by about $10bn per meeting until they disappear entirely before year end. Last week, the December jobs data challenged the comfortable assumption of accelerating GDP growth, and the publication of the latest FOMC minutes provided some interesting new insight into divisions within the Fed.Most analysts have responded to these events by concluding that nothing much has really changed. That is probably right, for now. Although the employment report was something of a nightmare, involving both a very weak gain of only 74,000 in nonfarm payroll employment and another disconcerting drop of 0.2 per cent in the participation rate, it is only a single month’s reading, amid a snap of very cold weather. Longer term, the combination of only moderate employment growth with a shrinking labour supply is a persistent phenomenon that is likely to challenge the FOMC increasingly as 2014 progresses. The minutes of the 17-18 December FOMC meeting report in detail the discussion that led to the decision to taper asset purchases last month. Tim Duy, as ever, provides an excellent analysis of opinion on the FOMC in his Fedwatch blog. My reading suggests that there are three broad groupings on the Committee, with the differences appearing much more stark in the interest rate expectations for 2015/16 than for 2014. This can clearly be seen by the dispersion on the FOMC’s famous “dots” chart, with my additions in red:
Fed Watch: Employment Report Keeps Policymakers on Their Toes - Just about everyone (myself included) who ventured a payrolls forecast was crushed by the scant December gain of just 74k. How much should you adjust your outlook on the basis of just this one number? Not much, if at all. It is important to watch for trends in the data, and always keep Barry Ritholtz's warning in the back of your mind: ...we know from each month’s revisions that the initial read is off, often by a substantial amount. It’s a noisy series, subject to many errors and subsequent corrections.To put this into some context, consider what it is we are measuring: The change in monthly hires minus fires. A monthly change in a labor force of more than 150 million people. That turns out to be a tiny net number relative to the entire pool -- about one tenth of one percent. Indeed, the December number was mitigated by an upward revision to November, leaving the growth pattern looking very familiar: One interpretation of the December outcome was that it was largely weather related. One would think, however, that such an event would have a forecastable negative impact on payrolls. Regardless, the bigger message is that the monthly change in payrolls is a volatile series, and one should be wary of putting too much emphasis on either small or large gains.Perhaps the real story then is that another existing trend in the data, the downward pressure on the unemployment rate from a falling labor force participation rate, continues unabated: Moreover, the pace of improvement in alternative measures of labor utilization is not accelerating and arguably appears to be slowing as might be expected if the formally cyclically unemployed increasingly become structurally unemployed:
Fed’s Plosser: Weak December Jobs Data Shouldn’t Affect Taper - Federal Reserve Bank of Philadelphia President Charles Plosser said Tuesday that weak December jobs data won’t stop the central bank from pressing forward with its plans to cut the pace of its bond-buying stimulus program. “I caution you not to read too much into one month’s number,” Mr. Plosser said in reference to last Friday’s release of hiring data that showed tepid employment gains and a drop in the jobless rate that was in large part driven by workers exiting the labor force. The surprising softness of the data caused some to question whether the Fed would continue to cut back on its easy-money stance, a process begun in December when the central bank trimmed the monthly asset-buying program from $85 billion to $75 billion. In an upbeat speech about the economy’s prospects, Mr. Plosser said there was no reason for the Fed not to press forward. “I believe the economy has met the criteria of significant improvement in labor market conditions for ending the program and that further increases in the balance sheet are unlikely to provide appreciable benefits for recovery,” the official said in the text of a speech prepared for delivery before an event in Philadelphia. Mr. Plosser is one of the Fed’s strongest advocates for winding down its stimulus efforts. He says that, with short-term rates pegged near zero percent, an end to bond buying would still leave the stance of monetary policy in a very supportive position for the economy. Mr. Plosser will be a voting member of the monetary policy setting Federal Open Market Committee this year.
Fed’s Lockhart: Taper Will Continue if Recovery Continues - Federal Reserve Bank of Atlanta President Dennis Lockhart said Monday that if the economy meets his expectations, he’d like to see the central bank continue to wind down its bond-buying stimulus effort over the coming months. Saying the economy looks to grow smartly in 2014, Mr. Lockhart said “if the positive outlook I’ve outlined plays out, I would support similar tapering steps over the course of this year.” He was referring to widespread expectations that the central bank will continue to cut the monthly pace of bond buying as the year progresses. In December, the Fed took the first step along this path when it cut the pace of purchases from $85 billion to $75 billion. The question of whether the Fed would continue to trim asset buying was called into question on Friday. The government reported surprisingly tepid December job gains and a drop in the unemployment rate that owed some of its seeming improvement to workers dropping out of the labor force. Many analysts expect the Fed to continue its gradual and steady pace of cuts in asset buying, but if coming months’ data is also weak, that could call into question how strong the recovery is. Mr. Lockhart, who is often viewed as a centrist among central bankers and a bellwether for the likely path of monetary policy, reminded an audience at a speech in Atlanta that the Fed is not on a preset path, saying the Fed “will assess how things are going, economically speaking, at each meeting, and decide on the next step.” He also said current Fed policy is “very accommodative” and “appropriately so.”
Fed Watch: Lockhart Greenlights Tapering - Atlanta Federal Reserve President Dennis Lockhart presented his 2014 forecast in a speech today. In short, he expects modestly better growth, ongoing improvement in labor markets, and inflation to gradually rise to the Fed's target. Pretty much the standard 2014 outlook, and with the usual caveats: There is still much progress to be made in labor markets, and inflation is currently on the low side. And, assuming all goes according to plan:If all goes as expected, there is a policy transition under way from a QE world, so to speak, to a post-QE world. As I said, that decision was made in December.Some of his more interesting comments come in the post-speech conversation with journalists. Michael Derby at the Wall Street Journal has the story. While the December employment number was a disappointment, it is not itself likely to deter policymakers from tapering plans: ...Mr. Lockhart told reporters what happened in the job market last month has not shaken his monetary policy outlook. “I don’t think we should overreact to one month” and should bear in mind employment data frequently undergoes notable revisions, he said.Lockhart's views on stock prices are intriguing: Mr. Lockhart rejected the idea that big gains in stock prices over the course of the last year mean the equities market has lost its moorings. “I don’t see it as a bubble,” the official said, although he added he would like to see company earnings validate the advances the market has experienced. The official also said “we are watching very carefully to make sure we don’t get into bubble territory.” He seems to be implying that he believes stock prices are reasonable only if earnings rise. Which is the same thing as saying he really doesn't believe that stock prices are exactly reasonable. They are just not sufficiently unreasonable to define as a "bubble."
Fed’s Fisher: Glad Fed Tapered, but First Cut Should Have Been Bigger - Federal Reserve Bank of Dallas President Richard Fisher said Tuesday that while he’s glad the central bank has begun to wind down its bond-buying stimulus program, he would have preferred a more aggressive start to the effort, in remarks that also suggested unease with current levels in the stock market. Mr. Fisher was addressing the Fed’s decision last month to cut the monthly pace of bond buying to $75 billion, from $85 billion, citing an improving economic outlook. The central banker has long opposed the effort, has repeatedly said it wasn’t doing the economy much good, and has wanted the Fed to curtail the buying even as most central bankers supported pressing forward with an effort they credit with boosting growth and the job market. He becomes a voting member of the monetary policy setting Federal Open Market Committee this year. “I was pleased with the decision to finally begin tapering our bond purchases, though I would have preferred to pull back our purchases by double the announced amount,” Mr. Fisher said in the text of a speech to be delivered in Dallas. That said, “the important thing for me is that the committee began the process of slowing down the ballooning of our balance sheet,” the size of which he is very concerned about. Mr. Fisher warned in his speech that the Fed’s aggressive provision of liquidity has caused a number of asset markets to rise more than economic fundamentals would indicate. He said central bank policy has in effect put “beer goggles” on investors, in reference to how excessive alcohol consumption can make the homely appear alluring to the amorously-inclined drinker. The Fed has made “an intoxicating brew as we have continued pouring liquidity down the economy’s throat,” Mr. Fisher said. He pointed to rising stock prices and bond market developments as a concern to him.
Fed’s Evans: Economy Needs Strong Fed Support for Some Time to Come - Federal Reserve Bank of Chicago President Charles Evans said Wednesday that while the labor market has improved enough for the central bank to begin cutting back on its easy-money policy stance, the Fed will nevertheless need to provide strong support for the economy for some time to come. “I anticipate highly accommodative monetary policy to continue to support the recovery,” Mr. Evans said in the text of a speech that was to be given in Coraville, Iowa. “After four years of weak and inadequate growth with low inflation, we need extraordinary monetary accommodation to finish the task at hand,” he said. Mr. Evans is one of the Fed’s strongest supporters of aggressive action to aid the economy. He has also been a vocal advocate for the central bank’s bond-buying stimulus efforts. The Fed decided to cut back on that front last month, trimming the monthly pace of purchases from $85 billion to $75 billion, citing improvement into the economy. Most expect to see further reductions over coming months and an end to the purchases this year. Mr. Evans said at the December Fed meeting “we decided that the cumulative improvement to that point met the criteria for first scaling back purchases.” But he added, “this decision does not, however, mean we thought the economy needed less overall policy accommodation.” That said, an unexpectedly weak December jobs report released Friday called into question the prospect of further cuts. Over this week, a number of central-bank officials have cautioned against reading too much into a single month’s data, and have said they continue to support slowing the pace of bond buying for now. Mr. Evans had little to say about where he thinks the bond-buying effort will go, but he defended the move to trim the purchases and agreed with those who believe last month’s jobs data may be an aberration.
Fed ‘needs to do more’ to stimulate economy - FT.com: The US Federal Reserve was being complacent by planning for years of below-target inflation, warned Minneapolis Fed President in a clarion call for more economic stimulus. “We’re running the risk of being content with inflation running consistently below our target. That’s inappropriate,” said Narayana Kocherlakota, who votes on Fed monetary policy this year, in an interview with the Financial Times. “Right now we’re sitting with an outlook for inflation that even by 2016 . . . is not getting back to 2 per cent.” Mr Kocherlakota’s remarks illustrate the growing anxiety about low global inflation that led Christine Lagarde, head of the International Monetary Fund, to warn this week that “rising risks of deflation” could be disastrous for the world’s economic recovery – calling it the “ogre that must be fought decisively”. They also underscore the challenges ahead for incoming chairwoman Janet Yellen, who will take over a Federal Open Market Committee that has begun to slow its monetary easing, but must still deal with a weak economy. Prices are up just 1.5 per cent on a year ago, data on Thursday showed. The Fed targets an annual inflation rate of 2 per cent. Mr Kocherlakota said the Fed should improve its communication about how it will behave once the unemployment rate falls below its existing threshold of 6.5 per cent. He said the pledge made in December of low rates “well past” that point is not sufficient. “The problem with what’s in the statement right now is its going to become increasingly less useful once we fall below 6.5 per cent,” said Mr Kocherlakota. Rather than lower the 6.5 per cent threshold, he said the Fed could bring in new guidance about how it will behave until unemployment hits 5.5 per cent, perhaps with a tighter get out clause on inflation.
Lacker Expects Fed to Study More Bond Reductions - Federal Reserve officials likely will discuss another reduction in their bond-buying program this month in response to a “distinct” improvement in the labor market, Federal Reserve Bank of Richmond President Jeffrey Lacker said Friday. “For me personally, it would take a very significant change in the outlook for me to support not tapering,” Mr. Lacker told journalists after addressing a meeting of the Risk Management Association here. “I don’t think the data we’ve seen so far are close to that,” he said. Recent data on the labor market and broader U.S. economy have been mostly positive. But a report from the Labor Department last week showed employers added just 74,000 jobs in December, sharply lower than in prior months. The downbeat reading was attributed partly to bad weather, and many economists said it might prove to be a fluke. “It looks like there’s a chance that it’s the type of aberrational report we get every so often,” Mr. Lacker said. “It doesn’t look like the harbinger of a shift in the trend,” he said. A drop in new jobless claims reported Thursday provided new evidence of a healing labor market. Jobless claims, a proxy for layoffs, fell to their lowest level since November.
Fed’s Williams Questions Whether QE Should Remain in Toolkit - Federal Reserve Bank of San Francisco President John Williams said in a new paper that researchers should continue to explore whether massive bond purchases should be part of the central bank toolkit when short-term interest rates are zero but the economy still needs support. “Should large-scale asset purchases be a standard tool of monetary policy at the [zero-lower bound], and, if so, how should they be implemented?” Mr. Williams asked . He said this and other questions need more study because being stuck at the so-called zero lower bound is a serious problem that policymakers are likely to confront again. Mr. Williams, who has been supportive of the Fed’s three rounds of bond purchases, said the measures “have proven a potent but blunt tool, with uncertain effects on financial markets and the economy.” The Fed’s bond-buying program, also known as quantitative easing, or QE, aims to lower long-term interest rates in hopes that will spur borrowing, hiring and investment. Surveying the body of research on such bond purchases, Mr. Williams found that studies consistently find that the purchases have a significant impact on long-term bond yields but it’s harder to tell if they’re doing much to help the overall economy. “Estimating the effects of large-scale asset purchases on the economy – as opposed to financial markets – is inherently much harder to do and is subject to greater uncertainty,” he said. Mr. Williams said estimates show that $600 billion of Fed bond purchases lowered the yield on 10-year Treasuries by approximately 0.15 percentage point to 0.25 percentage points, He noted that is a similar to the movement that would follow the Fed cutting short-term rates by 0.75 percentage point to a full percentage point – a relatively large rate cut.
A New Fed Study Destroys One Of The Central Tenets Of Monetary Policy - New research by Federal Reserve staff economists Steve Sharpe and Gustavo Suarez suggests that the outlook for business investment — a notably lacking aspect of this economic recovery — has little to do with changes in interest rates. "A fundamental tenet of investment theory and the traditional view of monetary policy transmission is that a rise in interest rates has a sizable negative effect on capital expenditures by businesses," write Sharpe and Suarez in a paper titled The Insensitivity of Investment to Interest Rates: Evidence from a Survey of CFOs. "Yet, a large body of empirical research offer mixed evidence, at best, for a substantial interest-rate effect on investment." In the paper, the economists examine data from the quarterly Duke University/CFO Magazine Global Business Outlook survey conducted in September 2012, which asked chief financial officers across companies of various sizes questions related to their spending plans. The main findings: The vast majority of CFOs indicate that their investment plans are quite insensitive to potential decreases in their borrowing costs. Only 8% of firms would increase investment if borrowing costs declined 100 basis points, and an additional 8% would respond to a decrease of 100 to 200 basis points. Strikingly, 68% did not expect any decline in interest rates would induce more investment. In addition, we find that firms expect to be somewhat more sensitive to an increase in interest rates. Still, only 16% of firms would reduce investment in response to a 100 basis point increase, and another 15% would respond to an increase of 100 to 200 basis points. In short, most firms wouldn't invest more if long-term interest rates were lower, and the majority wouldn't invest less as long as those rates weren't more than 300 basis points higher.
How the Fed’s “Wealth Effect” Quack Medicine Hurts Renters and With Them, Consumption - Wolf Richter - The “wealth effect” was held up by the Bernanke Fed as a pretext for printing money and creating asset bubbles. As prices were ballooning, those who owned the assets would feel wealthier and spend some of their gains, the theory went. This would somehow stimulate the broader economy, not just luxury retailers and Michelin-rated restaurants. But it didn’t work for everyone. Prices for housing have jumped and rents have jumped too, yet renters – there are 38.7 million of them, 34% of all households, according to the Harvard Joint Center for Housing Studies (PDF) – well, they saw their real wages decline by 7.6% between 2007 and 2012. An analysis of wage and housing data by the National Low Income Housing Coalition found that for someone earning the federal minimum wage of $7.25 per hour, an “affordable rent” of 30% of income would max out at $377 per month. But the average “zero-bedroom” apartment now goes for $680 per month. For a household to be able to afford that “zero-bedroom” apartment, it would need an annual income of $27,200. And it would need $39,080 a year to upgrade to their dream two-bedroom palace. At the same time, cheaper, older housing units are torn down to make room for more expensive condos and apartments – 12.8% of the units that had rented out for less than $400 a month met that fate between 2001 and 2011. It’s all part of urban renewal, but where the heck are the low-income renters supposed to go?
The Risks from Expansionary Monetary Policy - Brad DeLong -- Dallas Federal Reserve Bank President Richard Fisher: Beer Goggles, Monetary Camels, the Eye of the Needle and the First Law of Holes: Peter Boockvar, who is among the plethora of analysts… I regularly read… a rather pungent quote from a note he sent out on Jan. 2: …QE [quantitative easing] puts beer goggles on investors by creating a line of sight where everything looks good… For those of you unfamiliar with the term “beer goggles,” the Urban Dictionary defines it as “the effect that alcohol… has in rendering a person who one would ordinarily regard as unattractive as… alluring.” William McChesney Martin, the longest-serving Fed chairman in our institution’s 100-year history, famously said that the Fed’s job is to take away the punchbowl just as the party gets going… I see the argument that ultra-low safe interest rates–loose monetary policy now–or expected ultra-low safe interest rates–loose forward guidance–might, repeat MIGHT induce a “reach for yield” that would involve “beer goggles” in the sense of people who really shouldn’t be bearing risks bearing risks. But I do not see how this argument applies to quantitative easing…
Taming Bubbles is Hard, But Central Banks Can Try: Dallas Fed Paper - Can government officials pop an asset bubble by warning one is forming? New research from the Federal Reserve Bank of Dallas suggests a lot depends on timing and credibility. “We found that if a warning is issued in a definite range of periods around the starting period of the bubble, the bubble bursts with it,” wrote two economists, Yasushi Asako and Kozo Ueda of Waseda University in Tokyo, in a new working paper (“The Boy Who Cried Bubble: Public Warnings against Riding Bubbles”) released by the Dallas Fed. But if investors aren’t sure the warning is timed properly, “then it cannot stop the bubble immediately,” they warned. “While the bubble duration can be shortened by a premature public warning, it can be lengthened if it is accidentally late.” Bursting financial bubbles can cause deep economic damage, as demonstrated by the 2007 U.S. housing crash that sparked a financial crisis and deep recession. But, wrote Mr. Asako and Mr. Ueda ,a former Bank of Japan researcher, the public doesn’t always heed warnings about bubbles, such as then-Fed Chairman Alan Greenspan’s 1996 warning about “irrational exuberance” in the stock market. In their paper, the two economists propose a model by which a bubble can be burst if the public is warned one is forming, eliminating the ability of investors who detect it early to “ride” the bubble for their own benefit. If a warning comes as the bubble is forming, it will burst immediately, they wrote, and can even burst a little early because investors may want to sell. But in the “more realistic” situation when a warning is issued, but investors don’t know if it’s coming too early or too late, the effect is less immediate, they wrote. Credibility matters, they wrote, and governments “need to lower the probability of spurious warnings. In other words, governments must not be like the boy who cried wolf.”
Banks Were Willing to Pay Lots More in Crisis to Avoid Fed’s Discount Window -- Banks were willing to pay more — a lot more — to borrow money during the financial crisis if they could avoid using the Federal Reserve’s discount window, according to new research from economists at the Federal Reserve Bank of New York. The discount window is the Fed’s facility that provides banks with short-term loans, typically overnight. During the financial crisis, Fed officials worried banks would be wary of tapping the discount window when they faced a liquidity crunch for fear investors and depositors would see it as a sign of trouble. “The problem with the discount window is that people don’t like to use it because they view it as a risk that they will be viewed as weak,” William Dudley, now-president of the New York Fed, later told the government’s Financial Crisis Inquiry Commission. So the Fed created an alternative lending mechanism, called the Term Auction Facility, which auctioned funds en masse from December 2007 until March 2010. The new research found that the “stigma premium” was about the same whether they opted to borrow from the Fed or from private markets.The average premiums that banks paid to use the Fed’s TAF or to borrow from two private sources, the asset-backed commercial paper market and the tri-party repo market, “were very similar at 44, 42, and 47 basis points, respectively,” between December 2007 and October 2008,.
The Greatest Myth Propagated About The FED: Central Bank Independence (Part 3) - L. Randall Wray - Coda: Is the Fed Independent of Influence? In my two part series (here and here), I examined conventional views of (mostly) economists on the Fed’s supposed independence. What they focus on is the Fed’s independence from our elected representatives and as well on operational independence of the Treasury. The reason why they believe this is important is because the Fed is supposed to protect us—we can identify us as “money users”—from the danger that the “government” (Congress and Treasury), our “money issuers”, might conspire to degrade our currency by having the Fed “print money” to finance a profligate government. I think there is some argument for making some kinds of monetary policy—more broadly defined—behind closed doors and with independence. Deciding whether a troubled bank is troubled because it is insolvent or because it is illiquid is the kind of “monetary policy” decision that needs to be free of Congressional pressure. (If it is illiquid, lend; if it is insolvent, turn it over to the FDIC for resolution.) We saw what happened when the Keating Five Senators tried to protect Lincoln Savings and Loan from being resolved (luckily on the other end of that stick was my colleague Bill Black, who is like a bulldog when it comes to fighting corrupt senators, bankers, and regulators). Politicians always need money and banks and thrifts have the magic porridge pot, so elected representatives will always try to interfere with regulators and supervisors that go after a bank in “their” district. We have to insulate the Fed and the FDIC from that kind of interference. But what the Fed did during the GFC bail-out of Wall Street stunk. It was disgusting. Congress should not, cannot, let that happen again. That is what my project is all about. We do not want the Fed to have that kind of political independence. My project team broke the story of the Fed’s $29 TRILLION in loan originations to save the blood-sucking vampire squids of Wall Street.[1] This wasn’t a liquidity problem. It was an insolvency problem, with the major banks massively insolvent because their top management had turned them into what Bill Black calls “control frauds”. The Fed should not have the political independence to try to save fraudulent and insolvent financial institutions. Maybe we should have bailed them out (I think not)—like we bailed out the auto industry. But that should be done by Congress, not by unelected officials at the Fed.
U.S. Inflation Prospects Muted, Fed Survey Shows - Americans see low and stable inflation for the foreseeable future and gradual increases in home prices, according to a new consumer survey from the New York Fed.The median response saw consumer prices rising 3.1% over the next year. That would be above the central bank’s 2% inflation target and, for some, and a big jump from inflation last year, was running below 1% a year according to the Federal Reserve’s preferred measure.“Consumer expectations for overall inflation and home prices remained stable in recent months,” the New York Fed said in a statement. “Median earnings and household income growth expectations have remained steady and perceptions of credit access have improved slightly.”Low U.S. inflation has raised concern among Fed policy makers who say it makes the economy vulnerable to shocks and raises the cost of servicing debt.Americans see a less than one-in-five chance they will lose their jobs over the next 12 months, and see a 22% probability that they will leave their current position voluntarily. There were also hints that it was still difficult for the unemployed to reenter the labor market. “The mean probability of finding a job in three months, if one were to lose their job today remained steady at 46%,” the report said.
Key Measures Shows Low Inflation in December -- The Cleveland Fed released the median CPI and the trimmed-mean CPI this morning: According to the Federal Reserve Bank of Cleveland, the median Consumer Price Index rose 0.3% (3.1% annualized rate) in December. The 16% trimmed-mean Consumer Price Index increased 0.2% (2.2% annualized rate) during the month. The median CPI and 16% trimmed-mean CPI are measures of core inflation calculated by the Federal Reserve Bank of Cleveland based on data released in the Bureau of Labor Statistics' (BLS) monthly CPI report. Earlier today, the BLS reported that the seasonally adjusted CPI for all urban consumers rose 0.3% (3.6% annualized rate) in December. The CPI less food and energy increased 0.1% (1.3% annualized rate) on a seasonally adjusted basis. Note: The Cleveland Fed has the median CPI details for December here. Fuel oil and motor fuels increased sharply in December.This graph shows the year-over-year change for these four key measures of inflation. On a year-over-year basis, the median CPI rose 2.1%, the trimmed-mean CPI rose 1.7%, and the CPI less food and energy rose 1.7%. Core PCE is for November and increased just 1.1% year-over-year. On a monthly basis, median CPI was at 3.1% annualized, trimmed-mean CPI was at 2.2% annualized, and core CPI increased 1.3% annualized.
These measures suggest inflation remains below the Fed's target
Albert Edwards: We’re On The Cliff Of Deflation And Markets Don’t Seem To Care - Societe Generale's Albert Edwards has warned for some time that we are on the precipice of deflation. But in his new note to clients, he seems utterly bemused. Markets just don't seem to care. "Markets remain stoic about the risks of outright deflation in the US and eurozone for one very simple reason," he writes. "They simply do not believe a recession that would trigger outright deflation is on the horizon. Quite the reverse - they believe with all their heart that we are at the start of a self-sustained recovery. That is despite the fact that the US recovery is already noticeably longer than average, and that the classic signs of old age, such as rapidly slowing productivity growth and stagnant corporate profits, can clearly be seen." Market expectations of inflation — via the 10-year bond market — has "remained entrenched" above 2% for more than a year, Edwards writes. "A chasm is growing between reality, both on a core and headline basis, and expectations," he says. "If investors begin to doubt the economy recovery then they will no longer be able to ignore the lurking deflationary threat. Rapid market moves would ensue." Check out Edwards' chart:
U.S. Inflation Expectations: Low, But Rising - There's been a lot of talk lately about the threat of global deflation. According to Christine Lagarde, Managing Director of the IMF: “With inflation running below many central banks’ targets, we see rising risks of deflation, which could prove disastrous for the recovery.” And closer to home: Ms Lagarde’s comments were echoed by Charles Evans, president of the Chicago Fed. “The recent news on inflation has not been good,” he said in a speech on Wednesday. “Inflation is too low and is running well below the FOMC’s 2 per cent target.” Inflation in the U.S. is indeed running below target, but what about inflation expectations? Here are some market-based measures of U.S. inflation expectations (based on TIPS spreads) for two, five, and ten years out: According to this data, inflation expectations in the second quarter of 2013 declined significantly at all horizons. The sudden jump down in expectations in the summer corresponds with the sudden rise in Treasury yields associated with the so-called "taper tantrum" following the June 19 FOMC meeting. But it is interesting to note that immediately after the taper tantrum, inflation expectations recovered and stabilized, albeit at low levels (especially at the two and five year horizons). At the same time, nominal yields rose and remain elevated (with the 10 year hovering at or just below 3%). What is even more interesting the reaction of inflation expectations after the December 2013 FOMC meeting, where the taper was actually implemented (the timing of which came as a surprise to most market participants). Short-run inflation expectations, in particular, appear to be on an upward trajectory.
Fed's Beige Book: Economic activity increased "at a moderate pace" in Most Districts -- Fed's Beige Book "Prepared at the Federal Reserve Bank of Boston and based on information collected on or before January 6, 2014." Reports from the twelve Federal Reserve Districts suggest economic activity continued to expand across most regions and sectors from late November through the end of the year. Nine Districts indicated the local economy was expanding at a moderate pace; among these, the Atlanta and Chicago Districts saw conditions improve compared with the previous reporting period. Boston and Philadelphia cited modest growth, while Kansas City reported the economy held steady in December. The economic outlook is positive in most Districts, with some reports citing expectations of "more of the same" and some expecting a pickup in growth. And on real estate: Most Districts reported increases in home sales in the closing months of 2013 compared with last year, but the Atlanta, Cleveland, and Kansas City Districts indicated that year-over-year residential sales growth had slowed relative to earlier quarters in 2013. The Boston, Philadelphia, Minneapolis, and Dallas reports noted that at least some areas within those Districts saw home sales below year-earlier levels. Home Residential construction saw slight to moderate increases in most Districts; by contrast, Dallas cited a slight decline, New York reported no change, and Cleveland cited strong growth. Reporting Districts indicated that residential real estate contacts remained optimistic looking forward, while voicing concerns about declining inventory and potential changes in the mortgage market. The Richmond, Atlanta, Chicago, St. Louis, Minneapolis, Kansas City, Dallas, and San Francisco Districts reported that contacts expected residential construction to pick up in the near term.
Fed Beige Book: District by District Summary - The Federal Reserve’s latest “beige book” report Wednesday said economic activity expanded across most regions and sectors from late November through the end of the year. Nine of the twelve Fed districts said the local economy was expanding at a moderate pace, two reported modest growth, while one said the economy held steady.
Number of the Week: How 2013 Stacked Up, in Charts - 2013: A year of records, a bit of return to normalcy, but some continued struggles. This past year the Federal Reserve held more than $3.7 trillion in bonds on its balance sheet, boosting its total assets over to $4 trillion. Despite that, the yield on the 10-year Treasury rose to 3.04% from lower than 1.80% at the end of 2012 as investors’ suspicions that the Fed might eventually begin tapering became a reality and was announced at the FOMC’s December meeting. Mortgage rates started rising, crossing 4.50%, and ending the year higher than they started it for the first time since 2009. National prices for single-family home rose from their 2012 levels in every month through November according to CoreLogic‘s home price indexes. The prospect of bigger mortgage payments and higher prices contributed to a slowdown in sales of existing-homes in November. But overall rising home values and stock-market prices boosted household net worth. The S&P 500, the Dow Jones Industrial Average and household-sector net worth all reached record levels, nominally and adjusted for inflation. Inflation slowed, falling below the Fed’s target of 2%. The U.S. economy expanded at a seasonally adjusted annual rate of 4.1% in the fourth quarter. But the number of nonfarm jobs was still below its January 2008 peak level of 138 million in December’s first reading; unemployment fell to 6.7% from 7.9%, but the labor force participation rate fell as well, by 0.8 percentage point, that only 62.8% of those 16 and older were working or looking for a job at the end of the year. Wage growth has been tepid. But enough: Look at the charts; they will tell you more than words ever could.
When is a Bubble a Bubble? - Marshall Auerback: Bubbles have become a major focus of discussion in today’s financial markets. But very few people actually define what they mean when describing this financial phenomenon. In a recent Harvard Business Review blog post, economist Markus Brunnermeier had a go at it. Brunnermeier defines the leading characteristics of bubbles thusly:Bubbles are typically associated with dramatic asset price increases followed by a collapse. Bubbles arise if the price exceeds the asset’s fundamental value.Well, that’s part of it. It certainly describes a characteristic of bubbles – namely that they represent a massive fundamental departure from the asset’s underlying value. But does that give us everything? Bubbles also are about trend following behavior that develops positive feedback effects. Larry Summers and colleagues wrote a famous paper in 1990 that set out in simple terms this kind of trend following feedback dynamic. Didier Sornette has recently done the same, though in a very, very complicated way. Even though households have learned something from the two 50% bear markets in recent memory, in light of the recently rising stock market many now feel compelled to play the game. Money managers were taught the same lesson regarding potential loss from those two bear markets, and they also are now worried that the Fed will take the punchbowl away. But they, too, feel pressured by the past rising trend in stock prices to “play the game.” It is this feedback effect from a steeply rising trend in past stock prices that is the hallmark of a bubble. In the United States, we are in an incipient bubble stage in which households and money managers are tentative, cynical, self-aware trend chasers. It is the unwavering corporate net purchase of equities regardless of valuations that hold these less resolute players in the game. There is another important feature of bubbles – namely, that the acceleration of price as the object of the bubble (whether it be equities, bonds, real estate, Dutch tulips, or dotcom companies) goes way beyond the asset’s underlying value as the bubble itself matures and intensifies.
Does the U.S. Economy Need Bubbles to Live? - Larry Summers thinks the economy is broken, and has been for awhile. It's not just the Great Recession and the not-so-great recovery. It's the 8 years before that too. As Summers points out, even low interest rates, deficit-financed tax cuts, and nonexistent lending standards weren't enough to overheat the economy then. Sure, housing prices boomed, but nothing else did. Inflation was low, and unemployment wasn't that low. In other words, demand wasn't excessive, but it wasn't sustainable either. Summers worries that this isn't only a story about our economic past, but about our future, too. That we won't be able to create enough jobs without bubbles, now and forever. It's a new old idea called "secular stagnation." Economist Alvin Hansen first proposed it in the late 1930s when it looked like slow population growth might slow investment, and create a permaslump. But, thankfully, the baby boom, and 16 years of pent-up consumer demand proved him wrong. This time, though, might be different. See, there's something called the "natural rate of interest," which is the inflation-adjusted one that gets the economy to its Goldilocks state of low inflation and low unemployment. If the Fed sets rates above it, inflation should fall and unemployment should rise (though, in practice, wages and prices don't tend to fall below zero). As Summers points out, this natural rate has been negative for most of the last decade. And that's why we've alternated between bust and boom. The Fed's 2 percent inflation target means that even if it sets rates at zero, it might not be able to generate negative enough real rates to hit the natural one. That's the bust. But these kind of persistently low rates might eventually encourage risky behavior that, well, bubbles over. That's the boom. And our economic trap.
When Will Interest on US National Debt Exceed $1 Trillion? When Will the Fed Hike Rates? - With all the talk of tapering and expected hikes in interest rates by the Fed, inquiring minds are likely interested in what happens to interest on the national debt if the Fed ever does hike. I asked ny friend Tim Wallace to graph that idea. The Following charts from Wallace provide a clear answer. In these charts we make the assumption that the Congressional Budget Office (CBO) is accurate in its assessment of future budget deficits. Neither Wallace nor I believe those estimates, nor do we believe the Fed is going to be in a position to tighten when they suggest they might, but here are the charts for discussion.The current blended rate of interest on the national debt is a mere 2.4% according to the CBO. The "optimistic" projection of $668 billion assumes the rate will stay below 3.1% through 2020. With that in mind, please consider the Fed's 'hidden agenda' behind money-printing. One of the most important reasons the Fed is determined to keep interest rates low is one that is rarely talked about, and which comprises a dark economic foreboding that should frighten us all. But isn't it fair to ask what the interest cost of our debt would be if interest rates returned to a more normal level? What's a normal level? How about the average interest rate the Treasury paid on U.S. debt over the last 20 years? That rate is 5.7percent, not extravagantly high at all by historic standards. Do the math: If we were to pay an average interest rate on our debt of 5.7 percent, rather than the 2.4 percent we pay today, in 2020 our debt service cost will be about $930 billion.Now compare that to the amount the Internal Revenue Service collects from us in personal income taxes. In 2012, that amount was $1.1 trillion, meaning that if interest rates went back to a more normal level of, say, 5.7 percent, 85 percent of all personal income taxes collected would go to servicing the debt. No wonder the Fed is worried. The above article did not show the charts, but we just did.
Treasury: $53 Billion Budget Surplus in December - From the WSJ: U.S. Posts December Budget Surplus of $53.22 Billion Revenues outpaced spending by $53.22 billion in December, the first surplus for the month since the 2007 fiscal year and the biggest on record. Economists surveyed by Dow Jones had forecast a $44.5 billion surplus....The U.S. government's deficit for October through December totaled $173.60 billion, down 41% from the $293.30 billion shortfall during the same period a year earlier, the Treasury Department said Monday in its monthly report. The 2014 fiscal year started on Oct. 1. Here is the Monthly Treasury Statement for December. In December 2012 the deficit was $1.2 billion. Taxes were raised in January 2013, so the comparison next month will show how much of the improvement is related to taxes - and how much due to an improving economy. The deficit has declined very quickly over the last few years - and is no longer a short term issue.
4-Week Bill Prices At 0.000%, Bid To Cover Soars To Highest Since 2011 - Stocks may be masquerading as a big bounce today, driven by a VIX slam which has gotten the algos to ramp the S&P higher and of course a perfectly innocuous gold slam which as usual took out the entire bid stack, but the real money is furiously going elsewhere, such as today's 4 Week auction. Two things were notable: first - the rate was a solid 0.000%. This is not that surprising: after all under ZIRP, and as long as the Fed has control and the USD is the reserve currency, ultra-short term maturities are cash equivalent, which is why investors don't mind getting zero return in exchange for 1 month maturities. However, what was far more notable is that the Bid to Cover in today's auction just soared to 6.36x, highest than last week's 5.66x, and the highest since December of 2011, when the scramble into short-term paper was a function of year end window dressing (made since unncessary courtesy of the Fed's Reverse Repo facility).
Who Are The Top Holders Of US Treasurys - Yesterday, when the Treasury released its TIC data early by mistake, the update that China's holdings rose to a record $1.317 trillion caused a stir. This was confusing, since while China, which as we reported yesterday, now has a record $3.8 trillion in reserves having grown by $500 billion in 2013, has barely invested in US paper, and in fact going back to 2010, its holdings were a solid $1.2 trillion. In other words, its Treasury holdings have increased by a modest $100 billion in three years. Hardly anything to write home about. And certainly nothing to write home about when one considers the soaring Treasury held by the largest holder of US paper... everyone knows who that is. For those few who don't, and for everyone else too, here is the most recent breakdown of the top holders of US paper.
The Economy Is a Ponzi Scheme - I don’t think there’s anything eye-popping or revolutionary this post, but it’s thinking that I’ve been finding useful. Long before Larry Summers bruited his recent ideas about secular stagnation and the need for bubbles, I came up against this great line from Nick Rowe (April 2011): The economy wants a Ponzi scheme. I’ve been pondering that line ever since. (As usual with Nick, read the whole post.) Pretty quickly, I came to an even more radical belief:The economy is a Ponzi scheme. Economies are exercises in log-rolling, but with magical logs that expand when more people climb aboard and run faster, and and contract when people slow down or fall off. People can fall off because there’s not enough room on the log, because they can’t run fast enough, or because they try to stand still or run too slowly. To put it another way: Economies are confidence games. When people are confidently optimistic (the two are not synonymous), more people jump on the log and run harder, because they think there will be personal profit in it. But where does that confidence come from? I would suggest that most people form their expectations for the future based on the present and recent past. How much money do I have? How much is coming in? How do those compare to the recent past? The confidence story I’m telling here: people give huge weight to their current wealth/assets/net worth, and recent changes in those measures, when forming expectations for future growth — far more weight than they give, for instance, to their predictions of Fed behavior (the huge mass of people have no such predictions). This may be foolish or it may not be, but it’s what people do. (They undoubtedly also give big weight to current income and recent changes in income. I’ll let somebody else graph that.)
James Galbraith on the Predator State, Government Solvency - Yves Smith James Galbraith is a particularly effective communicator for an economist, so I thought readers would enjoy seeing him on the RT show Boom & Bust. Galbraith reviews some of his arguments from his early 2000s book The Predator State, which has proven to be prescient on many fronts (for instance, his must-read discussion of higher education). He also covers the issue of national solvency and under what circumstances countries can suffer. The short form is that a country that issues its own currency can’t become insolvent internally, but small countries are at risk that its trade partners will regard it with less enthusiasm, meaning its price falls, which results in inflation. Wealthy locals can also become disaffected and invest in foreign currency assets. This segment would serve as a good primer for friends and colleagues who wonder whether to believe scary talk about US deficits and the future of the dollar.
Fiscal Drag and Less Thereof - In much recent writing on fiscal policy, I’ve faced the hard fact that while it’s hard to imagine Congress doing much to help the economy, perhaps it’s not too crazy an ask to get them to do less to hurt it. A few recent data points suggest pretty strongly that my ask has been granted in the follow sense: there will be a lot less fiscal drag this year than last year. And a big part of that results from how freakin’ much fiscal drag there was in 2013. A summary measure of fiscal impulse (the extent to which fiscal policy is boosting or reducing GDP growth from one year to the next) is the difference between the deficit (or surplus) one year and the next. Since cuts in government spending reduce near-term growth, if the deficit-to-GDP ratio falls from 5% to 3%, that 2% fiscal drag. If the def/GDP ratio is unchanged year-to-year, there’s no change in fiscal impulse, neither drag nor boost. Since fiscal drag sounds like…you know…a drag, why would you ever want it? In a recession (or weak recovery from one), unless your Wolfgang Schauble–German finance minister and major austerion–the answer is you wouldn’t. But as the private economy hits its stride, in the interest of deficit reduction in good times, you don’t mind the drag. Treasury released the data yesterday that allows us to look at preliminary numbers for the calendar year 2013 budget deficit and I’ve plugged them into the table below. The deficit fell 47% in nominal terms, from $1.1 trillion to $561 billion, or more than 3% of GDP, an historically very large annual decline. About 60% of the reduced deficit came from higher tax receipts; 40% from lower outlays. This latter figure, however, is somewhat overstated due to transfers to the Treasury from Fannie and Freddie, counted as reduced outlays, but not really fiscal drag in the sense of less spending on activities that would promote growth; still, even without those remittances, we’d be looking at an unusually austere year (I also had to estimate 2013q4 GDP since it’s not out yet).
The Stakes of the Austerity Debate -- Those economists arguing for Keynesian stimulus policies are having a very hard time getting people on board. We've only been able to muster a half-measures stimulus plan and now we (and all of Europe) are on a course of pretty savage austerity plans, which are going to result in a lot of suffering and - as Keynes recognized - will end in violence if not solved (Keynes accurately predicted that austerity for Germany after WWI would lead to another world war). Keynesian liquidity-trap policies prescribe massive state borrowing and spending. This is a tough sell. We're trained to see debt as dangerous. This is certainly true on a household level, but it seems there are plenty of macroeconomists who are debt worriers as well. The retort - which is insightful, but dangerously inaccurate - is that economics is not a morality play. In liquidity-trap conditions, virtue is vice and vice is virtue. This is insightful, but dangerously misleading. To understand why, you have to first understand Virtue Theory.
U.S. Congress to pass stopgap funding bill next week: top Republican (Reuters) - The U.S. House of Representatives next week will pass a stop-gap funding measure to prevent a government shutdown for three days as negotiators try to finalize a $1 trillion spending bill, Republican Majority Leader Eric Cantor said on Friday. Cantor said the "continuing resolution" would keep the government open past a midnight Wednesday (0500 GMT) deadline through Saturday, January 18. This will allow more time for the spending bill to clear often lengthy procedural hurdles in the U.S. Senate. "We hope that they will finish their business by January 18th," Cantor said on the House floor. Lawmakers have been trying to reach agreement on the massive funding bill by January 15, when all government spending authority expires for military and domestic discretionary programs and federal agencies. But negotiators on the measure, which sets thousands of budget line items from national parks to Pentagon weapons programs, still have a number of funding and policy issues to resolve that will likely take through this weekend. "We're getting close, but not quite there yet," a House Republican aide said.
House-Senate Negotiators Seal $1 Trillion Spending Deal - House and Senate negotiators Monday unveiled a $1.012 trillion bill to fund the federal government for the next 8½ months, a compromise that marks a temporary ceasefire in the budget wars that have rocked Congress and the economy in recent years. The compromise restores some of the funding cut last year from domestic programs such as the National Institutes of Health and Head Start, but keeps overall discretionary spending lower than when President Barack Obama took office in 2009, when it totaled $1.013 trillion. The bill adhered to the parameters of the bipartisan budget deal approved late last year, as negotiators tried to steer clear of any controversial provisions that would provoke strong opposition from either side. Negotiators dropped many of the policy riders Republicans had pushed to reverse or block administration policies on environmental regulation, abortion and other issues. However, the bill didn't include funding for administration priorities conservatives opposed, such as construction of high speed rail. The bill held funding for the agency responsible for implementing the 2010 health care law at 2013 levels, and cut $1 billion from a related public-health fund. The measure was unveiled just two days before the government is due to run out of money. But congressional leaders have taken steps to avoid a government shutdown like the one that closed parts of the capital last fall. The House on Tuesday—and later the Senate—will pass a stopgap to keep the government open through Saturday, allowing time for the broader bill to be passed.
Lawmakers unveil massive $1.1 trillion spending bill in bipartisan compromise - Congressional negotiators unveiled a $1.1 trillion funding bill late Monday that would ease sharp spending cuts known as the sequester while providing fresh cash for new priorities, including President Obama’s push to expand early-childhood education. The 1,582-page bill would fully restore cuts to Head Start, partially restore cuts to medical research and job training programs, and finance new programs to combat sexual assault in the military. It would also give all federal workers a 1 percent raise. The White House and leaders of both parties praised the measure, which would fund federal agencies for the remainder of the fiscal year and end the lingering threat of a government shutdown when the current funding bill expires at midnight Wednesday. “The bipartisan appropriations bill represents a positive step forward for the nation and our economy,” White House budget director Sylvia Mathews Burwell said in a statement. The spending bill puts flesh on the bones of a bipartisan budget deal struck in December, when Republicans and Democrats agreed to partially repeal the sequester, heading off a roughly $20 billion cut set to hit the Pentagon on Wednesday and restoring funding to domestic agencies, which had already absorbed sequester reductions. Despite the increases, the bill would leave agency budgets tens of billions of dollars lower than Obama had requested and congressional Democrats had sought. That represents a victory for congressional Republicans, who, after three years of fevered battles over the budget, have succeeded in rolling back agency appropriations to a level on par with the final years of the George W. Bush administration, before spending skyrocketed in an effort to combat the recession.
1,582-Page Spending Bill Hinges On NSA Giving Congress 5 Years Of Records The 1,582-page (apparently bipartisan) omnibus spending bill announced last night adds up to a cool $1.1 trillion. As Bloomberg reports, lawmakers notes "not everyone will like everything in this bill," and we can see why. There is no IMF funding, nothing that "blocks Obamacare," the IRS gets a reprimand - barring them from targetng groups based on their ideological beliefs, preserves language that blocks Federal funding for abortions and spending any money to legalize marijuana. But, perhaps the most critical aspect of the bill is the NSA is required to give Congress number of phone records collected, reviewed during last 5 yrs, including estimate for records of U.S. citizens (among other things). Will that be one step too far for the administration? Via Bloomberg: Amendment to omnibus spending bill requires NSA to give Congress number of phone records collected, reviewed during last 5 yrs, including estimate for records of U.S. citizens.NSA would have to provide unclassified report describing all spy programs that collect bulk data, including cost of programs, types of records being collected, kinds of data NSA plans to collect in future. NSA would have to file second unclassified report listing terrorist activities disrupted with aid of bulk phone records, detailing whether necessary information could have been obtained by other means
Democrats concede to curb funds for Wall Street regulators in spending bill - Republican negotiators have reined in funding for Wall Street regulators as part of agreeing a $1.1tn federal budget, but dropped demands for further reductions in federal food stamp programmes that would have hit America's poorest families. The measures are among thousands of spending items contained in the so-called omnibus appropriations bill published on Monday night in a bipartisan effort to avoid another government shutdown when current authorisation expires on Friday. The House of Representatives is due to vote on the measure on Wednesday. If passed, it would be the first time since 2011 that Congress has agreed a detailed budget and builds on negotiations by senator Patty Murray and congressman Paul Ryan before Christmas to set broad tax and spending parameters. However, the final text, which runs to more than 1,500 pages, contains scores of politically contentious measures that may yet cause backlash among Democrats and Republicans. Hal Rogers, the Republican chairman of the House appropriations committee, singled out the budget for the Securities and Exchange Commission in a press release, which received $324m less than it requested and $25m taken from reserves he called “a slush fund”. Wall Street lobbyists have been pressing Congress to curb the growing power of regulators like the SEC in the wake of the financial crisis and Rogers said the spending bill had also designating $44m to an economic review of its rule-making process.
Five Reasons The Omnibus Appropriation Passed By Such Big Margins - In case you missed it, the FY2014 omnibus appropriation, which will keep the government funded through the September 30, that is, through the end of the fiscal year, passed the Senate yesterday 72-26. It was adopted by the House the day before 359 to 67. Here are the five quick reasons why the votes were so big and bipartisan.
- 1. The GOP is still hurting from the October government shutdown.
- 2. The omnibus gave the leadership a way to reward members for their votes in favor of the bill. This is real inside-baseball: An omnibus appropriation provided an opportunity for the leadership to buy support from reluctant members by providing more dollars for their pet programs and projects.
- 3. Most members of Congress like for appropriations. I know this is counterintuitive at a time when federal spending always seems to be under attack, but even the most conservative members of Congress like to vote for appropriations that will be spent in their districts and states, and their districts and states typically want the federal dollars that will be spent there.
- 4. There was no big issue the GOP wanted in exchange for passing the omnibus. The strategy has changed from October when defunding Obamacare was the price for Republican votes.
- 5. The Republican mainstream is trying to make the tea party wing look ineffective. There is a major effort currently underway in the Republican Party to stop the more extreme and unelectable candidates from being nominated in GOP primaries. Part of that campaign almost certainly includes limiting the tea party's apparent effectiveness on Capital Hill by denying it major victories like government shutdowns.
Spending Plan Ignores Overhaul for the IMF - The Senate on Thursday gave final approval to a $1.1 trillion spending bill for the current fiscal year, leaving behind what might have been the Obama administration’s best chance to overhaul the International Monetary Fund and meet its obligations to the world’s other economic powers. Administration officials concede that Congress’s decision not to make the changes will be an embarrassment to President Obama internationally, undermining future efforts to reach global economic accords. But congressional Republicans would not budge from their refusal to cede some control of the fund to China, India, Brazil and other emerging economic powers. The 1,582-page spending plan cleared the Senate overwhelmingly, 72 to 26, with no mention of the monetary fund omission. Mr. Obama has promised to sign the plan into law. The structural changes to the fund have languished since Mr. Obama agreed to the “rebalancing” with great fanfare at the G-20 meeting in Seoul, South Korea, in 2010. Powers like China have chafed at their status as junior partners at the monetary fund, even as they become major international lenders. In response, the world’s largest economies agreed to give up some of their authority at the fund — the international lender of last resort — to democratize the institution and head off efforts by China to create alternative funding sources.
IRS Gets Hammered in the 2014 Budget Agreement - The Internal Revenue Service is one of the biggest losers in the 2014 budget deal agreed to last night by House and Senate negotiators. Under the agreement, the service would get just $11.3 billion, which is $526 million below its 2013 budget and $1.7 billion less than President Obama requested. According to the House Appropriations Committee, the funding level would be lower than agency spending in 2009. The agreement would also require the IRS to spend more time and energy reporting to Congress on a range of activities. And, to the surprise of no one, it prohibits the use of any funds to single out groups based on their ideological beliefs or “to target citizens for exercising their First Amendment rights.”Those restrictions, of course, explain what this budget is really about: More political payback for the IRS’s bungled efforts to sort out which non-profits qualify for 501(c)(4) designation. While congressional Republicans tried mightily to pump up that episode into a major scandal, there is little evidence that the agency engaged in any nefarious political targeting. Rather, a combination of bad judgment and poor management resulted in the agency messing up a task for which it is singularly ill-suited–defining appropriate political speech.If you like irony, you might keep in mind that the 501(c)(4) mess was caused in part by a lack of resources. The short-staffed agency was so overwhelmed by requests for tax-exempt status that poorly trained workers tried to shrink the backlog with what turned out to be clumsy shortcuts (word searches for “tea party,” “progressive,” and the like). This will now get worse thanks to Congress and the new budget. For a nice summary of the consequences of IRS budget cuts, check out the latest report of the Taxpayer Advocate.
Charges Seen as Unlikely in Scrutiny by the I.R.S. — F.B.I. investigators do not believe Internal Revenue Service officials committed crimes in the unusually heavy scrutiny of conservative groups that applied for tax-exempt status, a law enforcement official said Monday. Prosecutors for the Justice Department who have been overseeing the case have not made a decision about whether to file charges against the officials — although that would seem unlikely given the F.B.I. investigators’ conclusion, according to the official, speaking anonymously because he could not talk on the record about a continuing investigation. Despite an admission by the I.R.S. that it inappropriately targeted conservative groups, by searching for groups with the words “Tea Party” or “Patriots” in their names, many legal experts and law enforcement officials say they do not believe that the scrutiny broke the law. Some members of Congress had called for the Justice Department to investigate the tax-collecting agency. The Wall Street Journal was the first to report Monday that criminal charges were unlikely. I.R.S. documents show the agency gave the same scrutiny to some liberal groups, using the key words “Progressive” and “Occupy.”
A free-trade bill that could help bolster the U.S. economy - Washington Post editorial - THE DEVASTATING impact of the Great Recession lingers on, as the unexpectedly poor Labor Department report on December job growth showed. The unemployment rate shrank three-tenths of a percent, to 6.7 percent, but mostly because 347,000 working-age people left the labor force altogether, while a mere 74,000 got hired. It doesn’t help matters that a disproportionate number of the jobless are long-term unemployed — and that Republicans are blocking an extension of unemployment benefits for them on Capitol Hill. Fortunately, though, a bipartisan group in Congress is pressing ahead with at least one measure that could help the U.S. economy grow and create employment: legislation to strengthen President Obama’s hand in negotiations for expanded free trade with Europe and the Pacific Rim. We refer to a proposal unveiled Thursday by House Ways and Means Committee Chairman Dave Camp (R-Mich.) and Sens. Max Baucus (D-Mont.) and Orrin G. Hatch (R-Utah), the chairman and ranking member of the Finance Committee, respectively. It would renew the “fast-track” procedures under which the House and Senate agree to vote on free-trade agreements without amendments or filibusters. Those procedures were last approved in 2002 and lapsed in 2007. By expediting congressional consideration, they streamlined past trade negotiations under both Republican and Democratic presidents, because U.S. trading partners knew that Congress couldn’t undo any deal they might strike with the executive branch. In return for ceding some legislative prerogatives, Congress appropriately demands a say in setting negotiating objectives, as well as a measure of enhanced oversight of the talks as they proceed.
Trans-Pacific Partnership: how the US Trade Rep is hoping to gut Congress with absurd lies - The US Trade Representative is pushing Congress hard for "Trade Promotion Authority," which would give the President's representatives the right to sign treaties like the Trans-Pacific Partnership without giving Congress any chance to oversee and debate the laws that America is promising to pass. With "Trade Promotion Authority" (also called "fast track"), Congress's only role in treaties would be to say "yes" or "no" to whatever the US Trade Rep negotiated -- so if the USTR papered over a bunch of sweetheart deals for political cronies with a single provision that politicians can't afford to say no to, that'll be that. Not coincidentally, the TPP is one long sweetheart deal with a couple of political sweeteners that no Congresscritter can afford to kill. The USTR's push for Trade Promotion Authority contains some of the stupidest, easy-to-debunk lies I've ever read. Either the Obama Administration figures that Congress is thicker than pigshit, or the USTR drafted this to give tame Congresscritters cover for selling out the people they represent to the corporations that fund their campaigns. Techdirt's Mike Masnick has undertaken the unpleasant chore of documenting and rebutting the Trade Rep's falsehoods point-by-point. Hell yes, it does. Trade Promotion Authority gives the power of regulating foreign commerce directly to the USTR, rather than Congress. It allows the USTR to negotiate a "final" agreement with other countries, which Congress cannot seek to change, amend or fix. Instead, Congress can only give a simple "yes or no" vote on what the USTR comes back with. Without TPA, the USTR actually needs to engage Congress, and win its support and approval on everything within the agreement. That gives Congress -- which is supposed to represent the public -- a chance to make sure that (as the USTR has shown a proclivity to do) the agreement is not filled with ridiculous "gifts" for cronies and friends at the expense of the public and disruptive innovation.
TPP v. Democracy - Last week, legislation to fast track a vote on the Trans Pacific Partnership was introduced in Congress. President Obama, who, along with advisors from several hundred corporations, has built the TPP in secret, away from the prying eyes of Congress or the public, desperately wants this fast track authority. The grant of that authority is, according to prevailing wisdom and the pro-neoliberal agenda Forbes magazine contributor Dan Ikenson describes as something being “widely considered necessary to complete and ratify the Trans-Pacific Partnership agreement between the United States and 11 other Pacific-bordering nations, as well as other prospective trade agreements." Why is Fast track so important? Because President Obama, and the corporate advisors he so willingly serves, knows full well that if there were a public debate on the TPP, not only would it never pass, but people would take to the streets in a 1999 Battle in Seattle WTO protests kind of way. The TPP is a Trojan horse that seeks to usher in a backroom secret sweetheart deal for the global elite. Fast track avoids public debate- and would ask for an up or down yes vote from members of congress who have not yet read the agreement. Neither have you. Some of you have read sections of the TPP, as published by WikiLeaks as we reported on this program last November:
The Trans-Pacific Partnership Is Not a Free-Trade Agreement - Dean Baker - I find "free-trade" twice in the text and once more in a quote in this short piece on the Trans-Pacific Partnership. It is an inaccurate characterization of the deal. Many parts of the deal have nothing to do with free trade; they are about setting regulatory standards. Some parts, like the section on patent and copyright protection, are about increasing protectionist barriers. This is 180 degrees at odds with free trade. So what's the problem here? Why does the NYT feel the need to waste words and makes its article longer in a way that misinforms readers. Can't it just refer to the Trans-Pacific Partnership as a "trade agreement?"
Congress is a millionaires' club. Why that matters -Duke University political scientist Nicholas Carnes wrote a fascinating pair of posts arguing that, when it comes to America's political system, class matters -- even more than a lot of us thought. The posts are based on his recent book, White Collar Government: The Hidden Role of Class in Economic Policy Making. It's hardly news to American voters that our elected officials tend to be wealthy, to a wildly disproportionate degree. But the extent to which this is so is stunning.Carnes points out that, although millionaires make up only 3 percent of the population, they "have a majority in the House of Representatives, a filibuster-proof super-majority in the Senate, a 5 to 4 majority on the Supreme Court and a man in the White House." At the same time, working class people -- whom he defines as "people with manual-labor and service-industry jobs" -- make up more than half of the population, yet people from working class backgrounds have never held more than 2 percent of the seats in Congress. You might suspect that a legislator's class background would not independently affect the policies she supports -- that, once you control for other factors like political party and constituents' views, the impact of class would disappear. But this is not the case; as Carnes writes, "even after controlling for these factors using a variety of statistical techniques, there are still significant differences between politicians from different classes." Looking at roll-call data in Congress, Carnes discovered that: At every level of government, in every time period and in every stage of the legislative process, the shortage of lawmakers from the working class tilts economic policy in favor of the conservative outcomes that more affluent Americans prefer.
Tax reform is the best way to tackle income inequality - Glenn Hubbard - Last month, President Obama called income inequality in the United States the “defining challenge of our time.” Unfortunately, the president’s nod to raising the minimum wage and transfer payments offers little hope for the success he seeks. The heated arguments for these moves miss the critical step toward reducing income disparities: economic inclusion, the ability to work and earn in the economy. Bold action is needed — and is best taken through tax reform rather than an expansion of the welfare state.Analysis of the weak earnings prospects of many Americans portrays a contest between those claiming the mantle of economic dynamism and those backing inclusion. An emphasis on dynamism — opportunities for commercially viable innovation — stresses the supremacy of economic growth: A rising tide lifts all boats. The president’s misconception of inclusion casts it as combating inequality via a higher minimum wage and enhanced unemployment insurance. But dynamism and true inclusion are not in opposition, particularly when more people are able to participate — obtaining rewarding work and a self-sustaining income. What is needed is a policy that furthers both objectives. By focusing on low-paid workers, the president’s effort on the minimum wage seems to advance inclusion but ultimately does not. A higher minimum wage raises neither hours worked nor employment. Indeed, a core failure of a higher minimum wage as an anti-poverty tool is that it does not tackle joblessness. A policy shift in favor of mass prosperity — dynamism and inclusion — is best conducted via fundamental tax reform. The discussion and policies to be considered, however, should look different from those in the present debate. The Obama administration has supported raising taxes on high-income earners and corporations to pay for expanded benefits to low-income Americans. Such an approach is unlikely to raise labor demand or labor-market earnings for those or other workers.
How Much Is Your Congressional Representative Worth: The Complete Infographic - As we reported several days ago, for the first time in history the majority of members of Congress currently have a net worth over $1,000,000. Of course, this also means that just under half are still aspiring to get in Wall Street's "preferred politician" rolodex, and says nothing about any one politico's individual's assets. So for all those curious how much their congressional representative is worth, the following comprehensive summary infographic from Vizual Statistix has the answers.
An Investment Manager’s 2014 Update on the Top 1% -- Since I wrote my analysis of the wealth and income of the top 1% for WhoRulesAmerica.net in mid-2011, economic and financial events have supported my original thesis. Wealth and income are streaming to the very top of the system and, particularly, to those who are direct or indirect beneficiaries of the financial industry. Professionals and workers have slipped further behind. The Federal Reserve's near-zero interest-rate policy and QE programs have pushed over 3 trillion dollars into the economy since 2009, stimulating speculation and Wall Street profits — while punishing conservative investors and savers with record low interest rates. The years 2009-2012 saw an enormous transfer of wealth upwards to the top 1% and, particularly, the top 0.1%. According to economists working with Census data at the Pew Foundation, from 2009 through 2011 (the latest available data), the net worth of the top 7% gained 28% while the bottom 93% dropped 4%. According to the Census Bureau, the official U.S. Gini coefficient — a measure of income inequality — was 46.9 in 2010, the most recent year for which data is available. It rises to 57.4 if capital gains are included, and capital gains primarily boost the incomes of the rich and very rich. Depending upon how income is defined, the US Gini varies from 37.0 (OECD) to 57.4 (Fed data). The CIA Factbook ranks the US as the 42nd most unequal country in the world, with a Gini of 45, and the OECD ranks it the 26th most unequal out of 33 developed countries. Most developed countries have Gini's in the high 20's to mid 30's, and even countries like Egypt (34.4) and Yemen (37.7) are more equal.
In Echo of Runup to Crisis, Bond Investors Reaching for Yield - An article in the Financial Times by Tracy Alloway gives yet another sighting that bond investors are getting a bit frantic in their hunt for yield. The piece has the eyepopping title, Yield-hungry investors snap up US homeless bond. It uses recent deals in the CMBS (commercial mortgage backed securities) market as a proxy for bond investors’ QE-driven hunt for more return. And the homeless part isn’t an exaggeration:One of the more eye-catching examples is a bond sold by Citigroup which is backed by 137 commercial mortgages. The bond includes a loan to 127 West 25th Street, a homeless shelter whose location in the fashionable Chelsea neighbourhood of Manhattan has raised the ire of some of the area’s residents. The bond was sold last year but has not previously been reported. Now as sensational as this sounds, this data point is hardly damning in isolation. Who is the lessor? New York City or a private body? If New York City, and the lease is long enough and has decent price escalations built in, this could actually a good if unconventional credit. And having 5-10% of a deal in unusual leases isn’t imprudent if the leases have stable enough tenants and/or compensating factors (like the yield on them really does compensate for the risk). But this is still a big departure from the usual constituent elements of CMBS deals, whose staples are conventional commercial properties, like high quality office buildings and malls. And the homeless shelter is far from the only exotic asset included in these transactions. One which is clearly high risk is the Kalahari Resort and Convention Center, “a chain of African-themed waterparks.” And the article makes clear that there are broader signs of frothiness:
JPMorgan and Madoff Were Facilitating Nesting Dolls-Style Frauds Within Frauds - According to the Securities Investor Protection Corporation (SIPC), the Justice Department prosecutors who settled the case against JPMorgan Chase used the investigative material from Picard to bring their charges and settle the case. Those court filings show layers upon layers of frauds within the Ponzi scheme. For starters, JPMorgan Chase used unaudited financial statements and skipped the required steps of bank due diligence to make $145 million in loans to Madoff’s business, according to Picard. Lawyers for the Trustee write that from November 2005 through January 18, 2006, JPMorgan Chase loaned $145 million to Madoff’s business at a time when the bank was on “notice of fraudulent activity” in Madoff’s business account and when, in fact, Madoff’s business was insolvent. The reason for the JPMorgan Chase loans was because Madoff’s business account, referred to as the 703 account, was “reaching dangerously low levels of liquidity, and the Ponzi scheme was at risk of collapsing.” JPMorgan, in fact, “provided liquidity to continue the Ponzi scheme,” Clearly, this is fraud number two on the part of someone – loan fraud. Fraud number three occurred when JPMorgan Chase and its predecessor banks extended tens of millions of dollars in loans to Norman F. Levy and his family so they could invest with the insolvent Madoff. According to Picard, Levy had $188 million in outstanding loans in 1996, which he used to funnel money into Madoff investments. Picard’s lawyers told the court that JPMorgan Chase (JPMC) “referred to these investments as ‘special deals.’ Indeed, these deals were special for all involved: (a) Levy enjoyed Madoff’s inflated return rates of up to 40% on the money he invested with Madoff; (b) Madoff enjoyed the benefits of large amounts of cash to perpetuate his fraud without being subject to JPMC’s due diligence processes; and (c) JPMC earned fees on the loan amounts and watched the ‘special deals’ from afar, escaping responsibility for any due diligence on Madoff’s operation.”
Citi and HSBC drawn deeper into forex probe - FT.com: Two banks were dragged deeper into the evolving scandal over possible foreign exchange market manipulation when it emerged on Friday that HSBC has suspended two of its traders and two Citi employees were on leave amid internal inquiries. Before Friday more than a dozen traders had been fired or suspended in connection with the investigation, highlighting how banks are stepping up their internal probes that have been prompted by multiple regulators in Europe and the US. HSBC joined a list of more than half a dozen banks to suspend traders when it took action against two middle-ranking traders in London. “HSBC can confirm the suspension of two foreign exchange traders in London,” the bank said and declined to comment further. At the same time, it emerged that US rival Citi had earlier this week put two G10 spot traders on leave
Did Banks Dump Structured Financial Products in Your Pension Fund? - As Ohio’s AG, Richard Cordray took JPMorgan Chase, Bank of America and Citigroup to court over their mortgage servicing practices, robo-signing, forclosure fraud, and losses to state pension funds. He asserted banks were “operating on a business model built on fraud” and “defrauded our courts” by presenting false evidence manufactured in boiler rooms. He wanted banks to halt foreclosures in every case where they presented the courts with false evidence. He also publicly criticized Bank of America and GMAC; and said Wells Fargo had a serious problem on its hands. Ryan Chittum at the Columbia Journalism Review highlighted the investigative journalism of the L.A. Times’s E. Scott Reckard who with Mike Hudson exposed mortgage lending boiler rooms in the last decade and the falsification of documents by mortgage lenders. Reckard wrote a recent article on unsound practices at Wells Fargo where branch employees are pushing unnecessary fee generating products on customers: To meet quotas, employees have opened unneeded accounts for customers, ordered credit cards without customers’ permission and forged client signatures on paperwork. Some employees begged family members to open ghost accounts.. I’ve written extensively how desperate banks accelerated sales of fraud-riddled residential mortgage backed securities and collateralized debt obligations as the market unraveled. In addition, variable-rate auction securities (also known as auction-rate securities or ARS), backed by municipal bonds, student loans, subprime mortgages, and/or subprime backed collateralized debt obligations, comprised a $330 billion market. By the end of 2007, municipal bond insurers, including MBIA and Ambac, that credit wrapped the ARS were in trouble after writing credit default protection on toxic collateralized debt obligations with banks. The same banks that blew up the monoline bond insurers dumped doomed ARS on investors.
Your Humble Blogger Speaks on RT: “Banks Are Still Getting Away With a Lot” - Yves Smith - I had fun on this interview, although there was one point where the host, Erin Ade, hit me with a remarkably broad question: what was the worst pre-crisis bank abuse? I neglected to include chain of title, the pretty much pervasive failure to transfer the mortgage rights as stipulated in securitization agreements to the trusts used to hold them. That actually was the most stunning thing I came across as more and more information came out after the the dust had settled. But it didn’t play directly into the meltdown, so I neglected to include it.
Banks Seek to Limit Volcker With Challenge to Meaning of ‘Own’ - U.S. banks are seeking to limit the reach of the Volcker Rule by challenging its definition of what it means to own a hedge fund or private-equity fund. The opening gambit was made by the American Bankers Association, the industry’s biggest lobbying group, which said in a federal lawsuit filed last month on behalf of community banks that regulators had defined too broadly what it means to have an ownership stake. A week later, four other organizations, including the Financial Services Roundtable, sent a letter to bank-supervisory agencies making the same point. Regulators, who spent more than two years writing the rule, defined ownership widely to capture all economic interests a firm might have in restricted funds. The ABA said it should be narrower, focusing only on equity, and that buying debt a fund sells doesn’t qualify as ownership. If the industry succeeds in getting the definition narrowed, that could allow banks to have the ties to funds the rule intended to outlaw.
Banks May Have Scored Hollow Victory on Volcker Rule/TRuPS CDO Compromise - Yves Smith - Readers may recall that banks, in their eagerness to depict the final Volcker rule as a terrible miscarriage of justice, made a great deal of noise about the case of Zions Bank, which was blaming $378 million of prospective losses on the Volcker-rule requirement that banks sell these dubious instruments called TruPS CDOs by July 21, 2015. Note that these CDOs were issued mainly by small banks and were attractive because they counted towards capital for regulatory purposes but they were regarded as debt instruments for tax purposes, so payments on them were deductible as interest. They also were bought to a significant degree by small banks. As we’ve noted, just about every element of this claim is bogus. The final Volcker rule was a victory for the banks. Occupy the SEC gave it a mere C-; Lee Sheppard, in a new Forbes article writes (with gory supporting detail): Even the dumbest banker can get around the Volcker rule. The regulators started with a weak statute, and managed to make it weaker. It’s as though they want to avoid offending the banks. As for the case of poor, supposedly victimized Zions, the bank’s tsuris really came from dodgy accounting. As we wrote in December: these losses weren’t “created” by the Volcker rule. Zions was simply fudging its accounting in a big way and the Volcker rule flushed it out. Alloway makes it clear where she comes out on this mess at the top of her post:“We haven’t forgotten who keeps us in business,” reads the slogan on the website of Zions Bancorp, Utah’s biggest bank. We assume they’re talking about their accountants. Jonathan Weil at Bloomberg is even more pointed in calling out the Zions misdirection: It turns out that a good-sized chunk of Zions Bancorp’s earnings existed only in its executives’ minds. Zions just didn’t have to recognize them before because of the way the accounting rules let companies report their bond holdings. In other words, the accounting rules had been letting Zions maintain a fiction.
An Occupy Wall Street Offshoot Has Its Day - Simon Johnson - To be sure, part of that 2011 movement was purely about expressing frustration – justified frustration – at how very powerful people in the finance sector had behaved and continue to behave. But the movement also led to an important offshoot or related development, Occupy the S.E.C., which focused on the Securities and Exchange Commission. This group wrote a brilliant commentary on the originally proposed Volcker Rule, which is designed to limit proprietary trading and other forms of excessive risk-taking at very large banks. Their comments, along with the work of others who wanted more effective reform, were helpful in pushing officials toward the final Volcker Rule, which was just unveiled. At a hearing of the House Committee on Financial Services on Wednesday, at which I testified, the broad outlines of the Volcker Rule are no longer resisted. When asked, none of the witnesses suggested that the Volcker Rule should be repealed. This is a big victory for Occupy the S.E.C. and all its allies. This point is well made by Alexis Goldstein, writing in The Nation. Ms. Goldstein was a co-author of the original Occupy the S.E.C. letter (see her article for relevant links) and reading that letter or her column makes it clear why this form of “populism” has been so effective. Ms. Goldstein and her colleagues are experts; they worked on Wall Street and, as a result, have compelling and highly relevant insights into how the very large trading operations there really work. This is not inside information so much as it is a granular understanding of who takes very large risks and why these so often go wrong.
Regulators Ease Volcker Rule Provision on Smaller Banks - Federal regulators on Tuesday bent to the will of the banking industry and some lawmakers and revised a rule that would have forced community banks to take write-downs on a security that many had invested in before the financial crisis. The revision to the Volcker Rule, announced late Tuesday by five regulatory agencies, would permit banks to continue to hold on to a special type of collateralized debt obligation. The Volcker Rule, as approved by regulators in December, would have forced banks to rid themselves of C.D.O.’s backed by trust-preferred securities, or TRuPS. The provision set off an uproar from the banking industry, which said it violated the intent of the Volcker Rule, which was meant to rein in risk-taking by big Wall Street banks and not to result in a financial hit to smaller ones. The American Bankers Association filed a lawsuit to block the provision from going into effect, contending it would force smaller banks to immediately write down the value of those C.D.O.’s. Some lawmakers on Capitol Hill also called on regulators to revise the rule to minimize the effect on community banks. The association’s initial response to the revised provision was favorable. “Our initial review of today’s action by the regulators suggests that the interim final rule provides a broad exemption for banks holding trust-preferred securities.” In its statement, the association said it would soon make a decision about whether to continue the legal challenge it filed in federal court.
TruPS CDOs now exempt from the Volcker Rule - Yesterday, after some intense industry pressure, US regulators (OCC, FDIC, SEC, etc.) collectively announced that the bulk of the so-called TruPS CDO securities issued prior to May 19, 2010 will be exempt from the Volcker Rule. Let's take a quick look at the issues around this decision. Trust Preferred Securities, issued mostly by banks, are longer-term fixed maturity securities that pay a fixed quarterly coupon. They are junior to any bonds but senior to common equity (similar to preferred stock). Securities issued by banks prior to May 19, 2010 qualify for tier-1 capital and were a good way for many smaller banks to raise capital. TruPS issued by multiple banks were pooled for diversification and funded by issuing "tranched" CDO debt. The coupon payments from the TruPS pool are used to repay this debt, with the higher rated tranches having a priority claim on these payments over the lower rated CDO debt. How does the media explain this exemption from the Volcker Rule? Here is an example from the WSJ. WSJ: - Banks had been seeking changes to a provision of the Volcker rule that would have forced firms to sell such debt investments by July 2015 to avoid violating the regulation. The so-called Trups CDO provision had sparked heated opposition from community bankers, who said the rule would unfairly harm hundreds of small banks that bought the investments by forcing them to take immediate write-downs on their holdings.
Regulators ease new bank rule on leverage to aid economy (Reuters) - Global banking regulators agreed on Sunday to ease the way a new rule, meant to rein in risky balance sheets from 2018, is compiled to try to avoid crimping financing for the world's economy. Sunday's decisions were the latest sign of how regulators have become more willing to accommodate banks as the focus switches to helping economies recover. The relief to lenders may, however, be temporary as the regulators signaled there is still no agreement on the final level of the new leverage ratio, which measures how much capital a bank must hold against its loans and other assets. The ratio was initially set at 3 percent of capital but supervisors from the United States, Britain and elsewhere are pushing for a higher proportion, a person familiar with the debate said. The ratio acts as a backstop to a lender's core risk-weighted capital requirements. A ratio of 3 percent means a bank must hold capital equivalent to 3 percent of its total assets.
Banks win Basel concessions on debt rules - FT.com: Global regulators have watered down controversial new rules aimed at reining in banks’ reliance on debt, following ferocious industry lobbying. Central bankers and supervisors on Sunday approved an international standard for the leverage ratio – a measure of financial strength that is considered less susceptible to being gamed by bankers – that offers some concessions to banks. The changes announced in Basel, Switzerland, will come as a relief to big investment banks who had been fretting they would be forced to raise billions in extra capital. The modifications ease the requirements for products, such as derivatives and repurchase agreements, which make up large parts of their balance sheets. Barclays was the biggest gainer on the FTSE 100 on Monday morning as a result, with its shares rising more than 3 per cent. Investors saw the other big winners as Deutsche Bank, sending shares in the German bank up 3.8 per cent, UBS, which rose 2.8 per cent, and Commerzbank, which gained 4 per cent. Daniel Davies, an analyst at Exane BNP Paribas, said the result was “more of a win for the industry than I was expecting”. A regulatory source said the effect of the adjustments could be to raise big global banks’ average leverage ratio from about 3.8 per cent to just over 4 per cent.
Missing the Point (Basel and Leverage) - The Basel Committee’s recent decision to change the definition of the leverage ratio is bad news for two reasons. There’s the obvious: A smaller denominator means less capital. The leverage ratio requirement says, in principle, that banks must have capital equal to at least X% of their total unweighted assets, where “assets” is supposed to include anything they hold that could fall in value. Take some bank that has some amount Y of traditional assets and other things that could fall in value, like derivatives positions. Then it has to have capital equal to X * Y / 100. If we take the exact same bank but decide to call Y some smaller number, say Z, then it can get bay with less capital. Less capital = more risk.Then there’s the slightly less obvious. The whole point of the leverage ratio is to safeguard against the ability of banks to game capital requirements based on risk-weighted assets. Under Basel I and II, banks had to hold capital equal to some percentage of their assets, but those assets were weighted according to their perceived (or politically defined) risk. Most notoriously, all sovereign bonds had a risk weighting of zero, no matter what country issued them, so if all you held was Greek bonds, you didn’t need to have any capital. The leverage ratio is supposed to provide a backstop so that no matter how clever the bankers and their lawyers are, the bank still has to hold some capital.
Are Banks About to Win on Commodities Trading After Their Success in Watering Down Basel III Capital Rules - Yves Smith - You know it’s bad when Bloomberg’s editors attack the banks’ win against regulators, in this case, their success in watering down already-too-generous Basel III capital requirements. And they look primed to score a twofer on pending rulemaking on trading in physical commodities. One of the hard-fought battles of Basel III was establishing limits on total leverage, as well as risk-weighted leverage. Basel II, which was implemented in Europe pre-crisis, called for risk-weighting of assets. You didn’t count every asset at its face or market value, add that up, and then use that to determine how much in equity a bank had to have as loss reserves; banks had to count only a percentage of the value of assets deemed to be less risky. For instance, the big reason Eurobanks wound up carrying huge holding of periphery country sovereign debt is that it carried a 0% risk weighting. We know how that movie turned out. And in general, that approach wasn’t terribly successful. As former central banker London Banker wrote: I was looking at the preferred asset classes under the Basel Accords…and realised that every single asset class that is given less than a 100 percent credit risk weighting is now tainted by widespread default, scandals or bailouts.The credit risk weightings mean that instead of reserving the standard 8 percent of capital in respect of a debt, the bank can cut that by the weighting applied to the asset class. Effectively, the reduction in credit risk weighting operates as a powerful subsidy to the borrowers and equally powerful incentive to over-leveraging the lenders. The FDIC noticed that the banks that looked well capitalized under these sort of risk weightings (US regulators allowed similar principles to be applied pre-crisis) but had low capital if you used a simple equity versus total assets measure were the most likely to fail. So Sheila Bair, with the support of Dan Tarullo at the Fed, pushed hard and won what sounds like a skimpy requirement for equity to total assets: 3%. But even that meager requirement had the banks grumbling.
Wall Street Mega Banks Own Tankers, Pipelines, Utilities, Mines, Metal Warehouses – And That’s Not the Worst of It - There was a distinct chill in the air yesterday as questioning got underway in the U.S. Senate’s hearing on whether the Wall Street mega banks that caused the greatest economic collapse since the Great Depression from 2008 through 2010 should be allowed to effectively control the price of aluminum and other metals by owning metal warehouses and creating bottlenecks in delivery; or allowed to own oil pipelines, terminals and tankers while trading trillions of dollars a year in oil futures – potentially rigging that market against the consumer. It’s not that there’s limited evidence that these firms will rig markets. These are the same firms that are serially charged and pay enormous fines for fraud and cartel-like behavior. Traders even refer to themselves as “The Cartel” and “The Bandits’ Club” in chat rooms. Then there was the fact that the day before the hearing, the Federal Reserve — which was set to testify at the hearing and is the very entity that is solely responsible for allowing Wall Street to turn itself into a commodities cartel by giving the firms waivers to enter the businesses — engaged in one of its favorite stalling tactics. Another chill came when Michael Gibson, one of the witnesses at the hearing who holds the position at the Federal Reserve of Director of the Division of Banking Supervision and Regulation, told the Senators that he is “not a lawyer.” This might explain why, when Gibson was pressed on questions of how many enforcement actions he had brought against Wall Street firms, he had to turn to his colleagues behind him, who apparently couldn’t answer the question either. Gibson had to say he would get back to the Senators on that question. Gibson’s background is just one more example of why the Federal Reserve is deservedly gaining the reputation as a strange duck regulator with speed dials to Wall Street, trading desks, relationship managers and routinely ignored, glaring conflicts of interest.
Bob Shiller Warns Fed 'Fire-Fighting' Is "Not A recipe For A Happy Ending" by Robert Shiller, originally posted at Project Syndicate, If we have learned anything since the global financial crisis peaked in 2008, it is that preventing another one is a tougher job than most people anticipated. Not only does effective crisis prevention require overhauling our financial institutions through creative application of the principles of good finance; it also requires that politicians and their constituents have a shared understanding of these principles. Today, unfortunately, such an understanding is missing. The solutions are too technical for most news reporting aimed at the general public. And, while people love to hear about “reining in” or “punishing” financial leaders, they are far less enthusiastic about asking these people to expand or improve financial-risk management. But, because special-interest groups have developed around existing institutions and practices, we are basically stuck with them, subject to minor tweaking. The financial crisis, which is still ongoing, resulted largely from the boom and bust in home prices that preceded it for several years (home prices peaked in the United States in 2006). During the pre-crisis boom, homebuyers were encouraged to borrow heavily to finance undiversified investments in a single home, while governments provided guarantees to mortgage investors. In the US, this occurred through implicit guarantees of assets held by the Federal Housing Administration (FHA) and the mortgage agencies Fannie Mae and Freddie Mac.
Growth in loans at US banks continues to weaken - Loan growth in the US continues to slow. Credit expansion is certainly not nearly as bad as what has transpired in the Eurozone (discussed here), but the slowing trend is unmistakable. The current rate of loan growth is now significantly below the nominal GDP expansion. One exception may be the corporate sector, where loan growth has been robust (see story). But as percentage of banks' total balance sheets, business loans are not growing. In fact much of the corporate debt growth is actually coming from outside the banking system (see post on shadow banking). Many expect that bank balance sheets will remain constrained by the new regulatory framework (Basel II, etc.), with loan growth continuing to stay weak. As a result, the increases in US broad money supply (M2) have slowed as well.This is one of the reasons inflation in the US has been subdued in spite of massive injections of liquidity by the Fed
Banks Say No to Marijuana Money, Legal or Not - In his second-floor office above a hair salon in north Seattle, Ryan Kunkel is seated on a couch placing $1,000 bricks of cash — dozens of them — in a rumpled brown paper bag. When he finishes, he stashes the money in the trunk of his BMW and sets off on an adrenalized drive downtown, darting through traffic and nervously checking to see if anyone is following him. Despite the air of criminality, there is nothing illicit in what Mr. Kunkel is doing. He co-owns five medical marijuana dispensaries, and on this day he is heading to the Washington State Department of Revenue to commit the ultimate in law-abiding acts: paying taxes. After about 25 minutes at the agency, Mr. Kunkel emerges with a receipt for $51,321. “Carrying such large amounts of cash is a terrible risk that freaks me out a bit because there is the fear in my mind that the next car pulling up beside me could be the crew that hijacks us,” Legal marijuana merchants like Mr. Kunkel — mainly medical marijuana outlets but also, starting this year, shops that sell recreational marijuana in Colorado and Washington — are grappling with a pressing predicament: Their businesses are conducted almost entirely in cash because it is exceedingly difficult for them to open and maintain bank accounts, and thus accept credit cards.
Why Do Banks Feel Discount Window Stigma? - NY Fed - Even when banks face acute liquidity shortages, they often appear reluctant to borrow at the New York Fed’s discount window (DW) out of concern that such borrowing may be interpreted as a sign of financial weakness. This phenomenon is often called “DW stigma.” In this post, we explore possible reasons why banks may feel such stigma. The problem of stigma has been a lingering issue throughout the history of the DW. Prior to 2003, banks in distress could borrow from the DW at a rate below the fed funds target rate. Because of the subsidized rate, the Fed was concerned about “opportunistic overborrowing” by banks. Accordingly, before accessing the DW, a bank had to satisfy the Fed that it had exhausted private sources of funding and that it had a genuine business need for the funds. Hence, if market participants learned that a bank had accessed the DW, then they could reasonably conclude that the bank had limited sources of funding. The old DW regime therefore created a legitimate perception of stigma.
Unofficial Problem Bank list declines to 613 Institutions -- This is an unofficial list of Problem Banks compiled only from public sources. Here is the unofficial problem bank list for January 10, 2013. Changes and comments from surferdude808: A few removals this week and the strengthening of an enforcement action are the changes to the Unofficial Problem Bank List this week. In all, there were five removals that leave the list with 613 institutions with $203.0 billion of assets. A year ago, the list held 832 institutions with assets of $310.7 billion.The OCC stepped up its enforcement action against Los Alamos National Bank, Los Alamos, NM ($1.5 billion) from a Formal Agreement to a Consent Order in December 2013. The bank has been operating under various corrective actions since 2010. Next Friday, we anticipate the OCC will release its enforcement action activity through the middle of December 2013.
Banks Keep Their Mortgage Litigation Reserves a Secret -- From JPMorgan Chase’s $13 billion settlement over mortgage securities to lawsuits brought by bondholders, a barrage of litigation has been raining down on Wall Street banks. Yet the banks are not disclosing a number that is crucial for assessing their ability to deal those legal costs. And, curiously, the regulator that has sway over companies’ disclosure practices has not called on the industry to reveal this important figure so that investors can weigh the institutions’ health. The banks are choosing to settle lawsuits for their roles in shoddy mortgage practices before the financial crisis of 2008, paying out multibillion-dollar sums to make amends. The size of JPMorgan’s settlement with the Justice Department, struck late last year, shocked many in the industry. Now, other large banks — in particular, Bank of America, with its enormous exposure to sour precrisis mortgages — are expected to announce painful deals with the government in the coming months. As these legal threats loom, the nagging question is whether the banks have properly girded themselves for the payouts. The banks are supposed to build up a financial cushion in advance to absorb the estimated cost of the payouts.Knowing the size of this cushion, called the litigation reserve, is extremely important to outsiders trying to weigh the financial strength of banks. For instance, if a bank’s litigation reserve turns out to be much too small for the agreed-to settlements, it could call into question the strength and management of the bank.
Commercial Real Estate Prices Post Steady Gains in November - With the U.S. economy on more solid footing during the fourth quarter of 2013 and demand for commercial real estate space on the rise, pricing continued on a steady upward trajectory in November 2013. The two broadest measures of aggregate pricing for commercial properties within the CCRSI—the value-weighted U.S. Composite Index and the equal-weighted U.S. Composite Index—advanced by 0.8% and 1.1%, respectively in November 2013, and rose by a more robust 10.9% and 7.8%, respectively, over the last year. Tenants occupied an additional 380 million square feet of office, retail and industrial space throughout the U.S. in 2013, the largest annual gain in net absorption over the past six years. The Investment Grade segment of the market continued to dominate in space absorption. However, the pace of absorption in the General Commercial segment has improved significantly as the recovery is accelerating in the secondary and tertiary markets. The General Commercial segment’s share of total net absorption increased from being less than 30% for the last several years to 32% in 2013. The percentage of commercial property selling at distressed prices was slightly more than 13% in November 2013, down roughly two-thirds from the peak in 2011. Technology and energy-driven markets including Houston, Denver, Dallas, and Austin have experienced some of the strongest declines in the share of distress property sales activity over the last year, with a reduction of 80% or more.
Mortgage Monitor: 2013 Vintage "best-performing on record", Purchase Mortgages over 50% of originations - Black Knight Financial Services (BKFS, formerly the LPS Data & Analytics division) released their Mortgage Monitor report for November today. According to LPS, 6.45% of mortgages were delinquent in November, up from 6.28% in October. BKFS reports that 2.54% of mortgages were in the foreclosure process, down from 3.61% in November 2012. This gives a total of 8.99% delinquent or in foreclosure. It breaks down as:
• 1,958,000 properties that are 30 or more days, and less than 90 days past due, but not in foreclosure.
• 1,283,000 properties that are 90 or more days delinquent, but not in foreclosure.
• 1,256,000 loans in foreclosure process.
For a total of 4,497,000 loans delinquent or in foreclosure in November. This is down from 5,350,000 in November 2012.
Five Housing Headwinds; Mortgage Originations Lowest Since 2010; Refinancible Loan Percentage Collapses; Payment Shock - Black Knight Financial Services, formerly LPS, released its latest Mortgage Monitor Forecast. Key Highlights:
- Mortgage originations are at the lowest levels in almost four years
- Prepayment/refi activity indicates another drop coming
- Higher interest rates slow refinance activity
- Quality of loans originated in 2013 have made it the best performing vintage on on record.
- Home equity originations are up significantly since a year ago: total HE lending is up 70%, while volume on 2nd mortgages has more than doubled
- Population of “refinancible” loans continues to shrink - Only 5.9M loans meet broadly defined criteria for refinancing, down 4M since December 2012.
- Delinquencies continue to rise among HELOCs that began amortizing
- High risk of “payment shock” in the coming three years
Here are some charts. Anecdotes in red are mine. Click on any chart for sharper image.
Deeply Underwater - With nationwide home prices in the United States rising at 13.6 percent between October 2012 and October 2013, all is looking well for America's much beleaguered home owners as we can see on this graph: Is the U.S. housing market really looking that healthy? How geographically balanced are the price increases and how many home owners are still being left behind? According to RealtyTrac, there are millions of American homeowners that are still suffering mightily. According to RealtyTrac's December U.S. Home Equity and Underwater Report, 19 percent of all properties in the United States with a mortgage are severely underwater, a situation where "the combined loan amount secured by the property is at least 25 percent higher than the property's estimated value". That's one in five American homeowners with a mortgage that is substantially higher than what their home is worth. Here is a graph showing the number of American homes with a Loan-to-Value ratio of 125 or greater: Certainly, things are improving if, indeed, you can call a situation where one in five homeowners are severely underwater "an improvement). Back in May 2012, 12.82 million American homeowners were severely underwater, representing 29 percent of all U.S. properties with a mortgage so yes, technically, things have improved. Among residential properties in the foreclosure process in December 2013, 239,470 or 48 percent of the total were deeply underwater, a drop from 299,773 or 56 percent of the total in September 2013. Looking at the housing situation from the other viewpoint, there were 9.1 million or 18 percent of all residential properties with a mortgage that had at least 50 percent equity. This has improved from 7.4 million properties or 16 percent of all mortgaged properties in September 2013, thanks largely to rapid price increases in some markets. Which areas had the highest percentage of deeply underwater residential properties? Here is a list of the states with the biggest problem in order from greatest to least:
In 15 states, deeply underwater foreclosures still reign - The housing market may be slowly improving, but weak spots remain. In 15 states, the share of “deeply underwater” foreclosures is larger than those with equity, according to housing data analyst RealtyTrac. But, overall, the December data show those deeply underwater foreclosures declining and homes rich in equity increasing. “During the housing downturn we saw a downward spiral of falling home prices resulting in rising negative equity, which in turn put millions of homeowners at higher risk for foreclosure when they encountered a trigger event such as job loss,” “Now we are seeing the reverse trend: rising home prices resulting in falling negative equity, which in turn is giving millions of homeowners a lifeline to avoid foreclosure.” The data measure underwater status by comparing the value of a home loan to the value of the home itself. A foreclosure was defined as “deeply underwater” when the homeowner owed at least 25 percent more than the value of the property. (The loan-to-value was 125 percent or greater.) A foreclosure with equity was defined as one where the value of the loan was equal to or smaller than the value of the home. (A loan-to-value ratio of 100 percent or less.) The states with the highest percentage of deeply underwater foreclosures were: Nevada (65 percent of foreclosures were deeply underwater), Florida (61 percent), Illinois (61 percent), Michigan (55 percent), and Ohio (48 percent).
Lawler: Preliminary Table of Distressed Sales and Cash buyers for Selected Cities in December - Economist Tom Lawler sent me the preliminary table below of short sales, foreclosures and cash buyers for several selected cities in December. This is just a few markets - more to come over the next week - but total "distressed" share is down significantly, mostly because of a decline in short sales. And foreclosures are down in all of these areas too.The All Cash Share (last two columns) is mostly declining year-over-year. As investors pull back in markets the share of all cash buyers will probably decline. In general it appears the housing market is slowly moving back to normal.
Lawler: Updated Table of Distressed Sales and Cash buyers for Selected Cities in December - Economist Tom Lawler sent me the updated table below of short sales, foreclosures and cash buyers for several selected cities in December.This is just a few markets - still more to come - but total "distressed" share is down in all of these markets, and down significantly in most. This is mostly because of a decline in short sales.And foreclosures are down in all of these areas too (except Springfield, Ill). The All Cash Share (last two columns) is mostly declining year-over-year. It appears investors are pulling back in markets like Las Vegas and SoCal - probably because of fewer distressed sales and higher prices.
Home (Finance) Repairs: Five years after the 2008 financial panic, there are still no concrete plans for what to do with the twin mortgage finance giants, Fannie Mae and Freddie Mac. The only consensus among Congress, the Obama administration, regulators and the banking industry is that no one knows what to do. No clear compelling vision for the federal government's role in residential mortgage finance has yet to be offered by a party to the debate.An essential requirement is any reform must deal decisively with the moral hazard baked into the current system. As recent events have painfully demonstrated, mortgage originators have every incentive to pump up the volume, casting a wide net, by cutting underwriting standards. Bad behavior is encouraged whether the mortgages are bought and repackaged by the government sponsored entities (GSEs) or by private asset-backed issuers. Now, if years later a bank is caught peddling duff mortgages, the resulting fine is just a belated cost of doing business. But complete privatization -- with no implicit or explicit federal guarantee -- may not be a viable option. Certainly, a privately owned entity has every incentive to push back dud loans to originators. Even a sterling quality mortgage portfolio though must be financed and supported by equity capital. In banking, alas, equity capital does not come cheap.
New plan to wind down Fannie and Freddie - FT.com: A group of Democratic congressmen on Thursday unveiled their plan to wind down US mortgage finance giants Fannie Mae and Freddie Mac, pitching it as an attractive alternative that could appeal to both political parties. The plan adds to the mix of bills in the Senate and House of Representatives aimed at resolving Fannie and Freddie, which needed a $188bn government bailout during the financial crisis and which are under federal conservatorship. The proposal by John Delaney, John Carney and Jim Himes substantially winds down Fannie and Freddie over five years, creating a path for their eventual sale. They said the plan provides the ideal private and public sector partnership by maintaining a government guarantee for mortgages, but having the private sector price the risk, which is more disciplined. “To ensure a stable housing finance system, we must move past the current state to a new system that engages more private sector capital,” Mr Delaney said. The number of proposals on Fannie and Freddie reflects the growing momentum to resolve the companies seen as one of the last remnants of the crisis. But there is nervousness among politicians, who want to ensure that any Fannie and Freddie plan would maintain access to affordable housing, including the 30-year fixed rate mortgage. There are also midterm elections in November, making it more difficult to move any sweeping bill through Congress.
As Refinancing Wanes, Banks Remain Wary of New Loans - The stars seem to be aligning in the housing market. Home prices have been rising for many months, and the federal government is providing immense support to bolster the mortgage market. The big banks that make home loans are strong enough to provide credit to borrowers, as seen in the fourth-quarter results reported Tuesday by JPMorgan Chase and Wells Fargo. Yet despite the confluence of promising signs, little in the vast system that provides Americans with mortgages has returned to normal since the 2008 financial crisis, leaving a large swath of people virtually shut out of the market. Even as the housing market improves, new home loans are still scarce as interest rates have started to creep up — a situation that was starkly underlined in the two banks’ results on Tuesday. The nation’s biggest mortgage lender, Wells Fargo, extended $50 billion in mortgages in the fourth quarter, down 60 percent from a year ago. The nation’s largest bank, JPMorgan, for its part, extended $23 billion in mortgages, down 55 percent from a year ago. The declines reflected the waning of the refinancing boom prompted by record low interest rates. Without substantial income from refinancing, the banks’ mortgage businesses will now depend on making fresh loans to purchase houses, a business that, despite some revival, remains tepid.
Are Subprime Mortgages Dying Or Dead? - Subprime mortgages are an endangered species. The problem is not that such loans can’t be made under Wall Street Reform, and it’s not that such loans won’t be made, it’s just that there will be a lot fewer of them. Subprime mortgages are appropriate for individuals with poor credit histories because such borrowers are seen as substantial credit risks. For instance, the FHA accepts borrowers with 3.5 percent down as long as their credit score is 580 or above. Below 580 you need at least 10 percent down. So we could define subprime borrowers as those with credit scores below 580, though some lenders might set the bar at 620 or even 640. Under the new mortgage rules which went into effect January 10, 2014, lenders can freely make subprime loans. However, if they want to offer subprime financing and have the loan defined as a qualified mortgage within the safe harbor created under Dodd-Frank then they must follow a number of guidelines. For instance, monthly debts cannot generally exceed 43 percent of the borrower’s income. Another standard limits lender compensation to fees and points worth not more than 3 percent of the loan amount for mortgages of $100,000 or more. Lenders might also make loans that are not “qualified mortgages” but the lender faces a lot more liability, not a good result at a time when lenders have recently paid out legal settlements of more than $100 billion to resolve past claims from borrowers, mortgage investors and government agencies.
Lenders search for plan B --Lenders and borrowers are looking to other avenues of borrowing as mortgage rates continue to rise and competition heightens among financial institutions.Rising home prices have helped bolster lender confidence, giving them a greater margin of cushion and fueling demand for home equity lines of credit, Bankrate Senior Financial Analyst Greg McBride said.This rise in demand for HELOC loans is boosted by McBride’s prediction that the economy will continue to improve and the Fed will continue to wind down their bond purchases. As a result, he believes it will lead to a consistent rise in mortgage rates throughout the year. According to Freddie Mac’s latest primary mortgage market survey, the 30-year fixed-rate mortgage averaged 4.53% for the week ending Jan. 2, 2014, slightly up from the last week of December when it averaged 4.48%.
Why banks aren’t lending to homebuyers - “Despite the confluence of promising signs,” write Peter Eavis and Jessica Silver-Greenberg today, “little in the vast system that provides Americans with mortgages has returned to normal since the 2008 financial crisis, leaving a large swath of people virtually shut out of the market.” This is absolutely true, and it’s a significant problem. To get a feel for just how sluggish the mortgage market is, my favorite chart comes from the Mortgage Bankers Association. Every month, the MBA releases its Mortgage Credit Availability Index, which makes it easy to concentrate on minuscule differences: in December, for instance, the index rose to 100.9, from 110.2 in November. But in order to see the big picture you need to zoom out and look at what credit availability was like before the financial crisis. And if you do that, the chart looks something like this: Of course, mortgage availability was way too lax in 2006-7, and the new index doesn’t have historical data going back before the end of 2010, so we can’t really see what was normal before things went crazy. But anecdotally, it’s much harder to get a mortgage now than it used to be. In the NYT article, the Center for American Progress’s Julia Gordon says that “a typical American family” with a credit score in the low 700s is “being left out”: that’s a very long way from subprime, which is what you’re considered to be when your credit score is below 620. Why are banks so reluctant to lend? It’s not because of new rules about qualified mortgages, or anything regulatory at all, really. Instead, it’s much simpler: To put it another way, would you lend money fixed for the next 30 years at a rate of less than 5%?
Credit standards going easy on jumbo mortgages -- Despite overall originations hitting the lowest level since 2010, the past year witnessed a significant increase in the volume of home equity loans and lines of credit, in addition to originating the best-performing mortgages on record, the first report from Black Knight Financial Services, previously known as Lender Processing Services, found. For jumbo mortgages, however, it's a completely different story. Two key points about the November numbers stand out according to Herb Blecher, senior vice president of Black Knight Financial Services’ data & analytics division.“First is that heightened credit standards have resulted in this year being the best-performing vintage on record. Even adjusting for some of these changes, such as credit scores and loan-to-values, we are seeing total delinquencies for 2013 loans at extremely low levels across every product category,” Blecher said.The second point Blecher emphasized was that overall volumes are down. “We are seeing an increased proportion of the market being supported by non-agency (vs. government) lending – with the share nearly doubling as compared to 2010,” Blecher added.However, increasing home prices have helped offset some of the drop in originations with demand for home equity loans increasing.“While first mortgage originations are almost half the levels as one year ago, total home equity lending, including loans and lines, has increased by 70%, and originations of second lien home equity loans have more than doubled,” Blecher said. In addition, the market also observed a 75% year-over-year increase in the share of non-agency jumbo prime lending.
Why Credit Scores Dropped on New Mortgages in 2013 - A new report provides some evidence that it may have become a little easier for some Americans to get a mortgage as the housing market improves and lenders grapple with a pullback in refinancing amid higher mortgage rates.The average credit score for approved mortgages fell to 727 in December, down from 748 one year earlier, according to a report released Wednesday by Ellie Mae, a mortgage technology firm. (Under a system devised by Fair Isaac Corp.FICO +0.33%, credit scores run on a scale from 300 to 850.)The report said that some 46% of mortgages that closed in December had credit scores above 750, compared with nearly 57% one year earlier. Meanwhile, around 31% of loans had credit scores below 700, up from 21% one year earlier. Ellie Mae, a mortgage software provider, tracks the characteristics of loans run through its platform.The data also showed that the average debt loads of borrowers increased. On average, total monthly debt for borrowers whose loans closed in December stood at 39% of their incomes, up from 35% in June and 34% in January. Rising interest rates and home prices could account for some of the increase in debt-to-income ratios.Why might credit standards appear to have eased, if only very slightly, last year?
- First, home prices have stopped falling and the economy is slowly improving, making lenders more comfortable to extend loans.
- Second, big drops in refinances, which have slumped after interest rates rose last summer, could also lead lenders to become more competitive for home purchases.
- Third, analysts say it is normal for borrowers with weaker credit to seek out refinancing as rates go up and as the refinance cycle nears its end.
MBA: Mortgage Applications Increase in Latest Weekly Survey - From the MBA: Mortgage Applications Increase in Latest MBA Weekly Survey Mortgage applications increased 11.9 percent from one week earlier, according to data from the Mortgage Bankers Association’s (MBA) Weekly Mortgage Applications Survey for the week ending January 10, 2014. The previous week’s results included an adjustment for the New Year’s holiday. ... The Refinance Index increased 11 percent from the previous week. The seasonally adjusted Purchase Index increased 12 percent from one week earlier, but is at a level similar to what was observed in mid-November 2013. ...The average contract interest rate for 30-year fixed-rate mortgages with conforming loan balances ($417,000 or less) decreased to 4.66 percent from 4.72 percent, with points increasing to 0.33 from 0.28 (including the origination fee) for 80 percent loan-to-value ratio (LTV) loans. The first graph shows the refinance index. The refinance index is down sharply - and down 70% from the levels in early May. With the rate increases, refinance activity will be significantly in 2014. The second graph shows the MBA mortgage purchase index. The 4-week average of the purchase index is now down about 8% from a year ago. The purchase index is probably understating purchase activity because small lenders tend to focus on purchases, and those small lenders are underrepresented in the purchase index.
Weekly Update: Housing Tracker Existing Home Inventory up 2.0% year-over-year on Jan 13th Here is another weekly update on housing inventory ... for the thirteenth consecutive week, housing inventory is up year-over-year. This suggests inventory bottomed early in 2013. There is a clear seasonal pattern for inventory, with the low point for inventory in late December or early January, and then peaking in mid-to-late summer. The Realtor (NAR) data is monthly and released with a lag (the most recent data was for November). However Ben at Housing Tracker (Department of Numbers) has provided me some weekly inventory data for the last several years. This graph shows the Housing Tracker reported weekly inventory for the 54 metro areas for 2010, 2011, 2012, 2013 and 2014.In 2011 and 2012, inventory only increased slightly early in the year and then declined significantly through the end of each year.Inventory in 2014 is now 2.0% above the same week in 2013 (red is 2014, blue is 2013). Inventory is still very low - and barely up year-over-year - but this increase in inventory should slow house price increases.
FNC: House prices increased 6.7% year-over-year in November - From FNC: FNC Index: November Home Prices Up Steadily by 0.5% The latest FNC Residential Price Index™ (RPI) shows U.S. home prices continuing to rise at a modest pace despite at a flatter rate when compared to the spring and summer months. This trend largely reflects a decline in housing activity. The index, constructed to gauge underlying property value based on non-distressed home sales only, was up 0.5% in November despite greater downward pressure from rising foreclosure sales during the month. In November, completed foreclosure sales nationwide rebounded to 16.8% of total home sales, up from October’s 14.4% or August’s post-crisis lows of 12.6%. Based on recorded sales of non-distressed properties (existing and new homes) in the 100 largest metropolitan areas, the FNC national composite index shows that in November home prices rose at a seasonally unadjusted rate of 0.5%, which slightly outpaced October’s price gain. The two narrower indices (30- and 10-MSA composites) likewise show a small uptick in November’s price increase in the nation’s top housing markets. The indices’ year-over-year trends show that as of November 2013 (or 21 months into the housing recovery), annual home price appreciation has reached about 7.0% -- a pace last observed in August 2006. The 100-MSA composite was up 6.7% compared to November 2012. The FNC index turned positive on a year-over-year basis in July, 2012.This graph shows the year-over-year change for the FNC Composite 10, 20, 30 and 100 indexes
Welcome To The Blackstone Recovery: Over 11 Million Americans Spend More Than Half Their Income On Rent - As we wrote most recently in November, the median asking rent in the US just rose to an all time high... ... explained by the lowest US homeownership rate in nearly 20 years. And while the charts above mean another year of record bonuses for America's largest landlord, Wall Street-based Blackstone, they also mean something else for millions of ordinary Americans: a choice, which as Bloomberg summarizes, “We either eat, or we pay rent.” Indeed, in the new normal, the recovery means an ordinary American worker either has a roof above their head, or food on the plate. The two increasingly are exclusive. No, that's not a joke: here are the facts - an estimated 11.3 million Americans were spending more than half their income on rent in 2011, according to the Harvard analysis based on latest available Census data. That number represented a 28 percent increase from 2007. Stagnant incomes and increased demand for cheap apartments spurred the rise. Between 2007 and 2012, real median renter incomes fell by 7.6 percent, based on Census data compiled by the Joint Center. The number of renters climbed 11 percent between 2007 and 2011, U.S. Department of Housing and Urban Development data show. A Census report released this month found that 31.6 percent of Americans lived in poverty for at least two months between 2009 and 2011, an increase from 27.1 percent over the 2005 to 2007 period. And the nail in the coffin: the annual rate of change in real disposable income per capita just went negative.
Housing Recovery Is Here to Stay, Dallas Fed Says -- The U.S. housing recovery appears sustainable, according to new research from the Federal Reserve Bank of Dallas. “A necessary condition for the home construction recovery to continue is a sustainable home-price turnaround,” wrote John Duca, vice president and associate director of research at the Dallas Fed, in a report titled “The Long-Awaited Housing Recovery.” Based on several metrics, he wrote, “this condition appears to have been met.” U.S. home prices bottomed out in 2011. Their subsequent rise, Mr. Duca wrote, appears consistent with “key measures” such as the inventory of homes on the market, the cost of renting versus owning and the affordability of mortgage payments.Still, he wrote, “while the U.S. housing recovery will probably continue for some time, its pace and composition will be affected by the nature of the labor market recovery, the movement of mortgage interest rates and the difficult-to-predict evolution of credit availability to prospective homebuyers and to homebuilders and developers.”
Housing Starts at 999 Thousand Annual Rate in December - From the Census Bureau: Permits, Starts and Completions: Privately-owned housing starts in December were at a seasonally adjusted annual rate of 999,000. This is 9.8 percent below the revised November estimate of 1,107,000, but is 1.6 percent above the December 2012 rate of 983,000. Single-family housing starts in December were at a rate of 667,000; this is 7.0 percent below the revised November figure of 717,000. The December rate for units in buildings with five units or more was 312,000. An estimated 923,400 housing units were started in 2013. This is 18.3 percent above the 2012 figure of 780,600. Privately-owned housing units authorized by building permits in December were at a seasonally adjusted annual rate of 986,000. This is 3.0 percent below the revised November rate of 1,017,000, but is 4.6 percent above the December 2012 estimate of 943,000. Single-family authorizations in December were at a rate of 610,000; this is 4.8 percent below the revised November figure of 641,000. Authorizations of units in buildings with five units or more were at a rate of 350,000 in December. The first graph shows single and multi-family housing starts for the last several years. Multi-family starts (red, 2+ units) decreased in December (Multi-family is volatile month-to-month). Single-family starts (blue) also decreased in December following the sharp increase in November. The second graph shows total and single unit starts since 1968.
Vital Signs: Housing Still Has More to Give - The housing industry is back from its bust. Housing starts seesawed in the final months of 2013, but for the fourth-quarter, starts averaged a monthly annual rate of just over 1-million units, the best performance since the second quarter of 2008 and close to double the worst pace during the recession. The increase suggests residential construction contributed to gross domestic product growth again in the fourth quarter. A survey of its members done by the National Association of Home Builders, out Thursday, shows builders are optimistic about future demand. That confidence is driving developers to break ground now. “There has been a new-found urgency to beef up what have been skimpy inventories of new homes for sale,” says Stephen Stanley, chief economist at Pierpont Securities, “In short, builders are eager to get more homes started now because they expect the buyers to come out in force in the spring.”
Housing permits and starts record lowest YoY improvement since May 2011: The last report for housing permits and starts for the year 2013 is in, and it shows that the deceleration in growth since mortgage interest rates started to increase has continued. Housing permits came in at 986,000 only 43,000 or +4.6% higher YoY. Starts came in at 999,000, only 13,000 or 1.6% higher YoY. So here is the "Graph of the Year" for 2014, showing the YoY% change in housing permits (blue), starts (green) and mortgage interest rates (red, right scale) at the end of 2013: Here is the same information, this time quarterly to smooth out some of the noise, and measured by the YoY change in the number of housing units (iin thousandsa): Notice that the decelerating trend started at mid-year 2012, and the YoY% deceleration is about 20%. If this trend continues, then by the end of the first half 2014, permits and starts should have declined at some point about 10% YoY or -100,000 units. And I believe the trend will continue.
Starts Plunge 9.8% As Housing Permits Miss By Most In 7 Months - Last month's record-breaking surge in housing starts has rapidly reversed and fell 9.8% MoM - the biggest drop since April 2013. Despite a plethora of revisions, single unit housing starts tumbled to 610k - the lowest since July. However, permits were dismal (which is what we should be caring about if we are looking ahead at how the 'recovery' will play out). Building Permits dropped 3% MoM, far more than expected, missing by the largest gap since June. This was the 3rd biggest monthly drop in total starts since Lehman. However, year-over-year, the data is abysmal - Starts rose at the slowest pace since Aug 2011, and Permits at the slowest pace since April 2011.
Housing Starts in 2013: 18% Annual Increase, Still Sixth Lowest Level on Record --A few key points:
• Housing starts increased 18.3% in 2013 (initial estimate). This was another solid year-over-year increase.
• Even after increasing 28% in 2012 and 18% in 2013, the 923 thousand housing starts in 2013 were the sixth lowest on an annual basis since the Census Bureau started tracking starts in 1959 (the three lowest years were 2008 through 2012). Also, this was the fifth lowest year for single family starts since 1959 (only 2009 through 2012 were lower).
• Starts averaged 1.5 million per year from 1959 through 2000. Demographics and household formation suggests starts will return to close to that level over the next few years. That means starts will probably increase another 50%+ from the 2013 level.
• Residential investment and housing starts are usually the best leading indicator for economy. Nothing is foolproof as a leading indicator, but this suggests the economy will continue to grow over the next couple of years.
The following table shows annual starts (total and single family) since 2005:
Housing Now Providing a Tailwind to Economic Growth - While residential investment represents a small portion of gross domestic product (GDP), housing is perhaps one of the most cyclical sectors of the economy and tends to lead economic swings by months to years. As such, keeping a close eye on housing provides a valuable insight into future economic trends. While housing represented a major headwind to the economy after the housing bubble burst, as I show below, it is now providing a major tailwind instead. At the peak in 2005 housing represented 6.26% of GDP, the highest level seen in over a half century. Once the housing bubble burst and things came to a standstill, housing activity relative to GDP fell to levels never seen before and hit a low of 2.22% in early 2011. After the late 2005 peak housing’s positive contribution to GDP began to decline and by the middle of 2006 began to subtract from GDP. Then, from late 2006 through much of 2009, housing was shaving roughly 1% off of GDP. As housing began to stabilize in 2010 and 2011, it stopped dragging the economy down and, beginning in 2012, actually started adding to GDP growth. As of last year, 2013, housing has added roughly 0.40% to GDP each quarter and now represents a tailwind to the economy. The current improvement in the housing sector is no small thing since it plays a key role in the economy. As such, it also acts as a leading economic indicator. A pickup in housing activity is followed by improvements in many other areas of the economy down the road. One direct beneficiary of this is state and local governments—an area that has also been a drag on the economy as they've been forced to tighten their belts and cut back on expenditures.
An Update On The Housing "Recovery" - The housing recovery is ultimately a story of the "real" employment situation. With roughly a quarter of the home buying cohort unemployed and living at home with their parents the option to buy simply is not available. The rest of that group are employed but at the lower end of the pay scale which pushes them to rent due to budgetary considerations and an inability to qualify for a mortgage. The optimism over the housing recovery has gotten well ahead of the underlying fundamentals. While the belief was that the Government, and Fed's, interventions would ignite the housing market creating a self-perpetuating recovery in the economy - it did not turn out that way. Instead, it led to a speculative rush into buying rental properties creating a temporary, and artificial, inventory suppression. While there are many hopes pinned on the housing recovery as a "driver" of economic growth in 2014 - the lack of recovery in the home ownership data suggests otherwise.
Fannie Mae warns of fall in US house prices - Weakening demand by financial companies that have been snapping up thousands of US homes on the cheap could fuel a future fall in house prices, the chief economist of Fannie Mae has warned. The warning is one of the first instances of a US government agency voicing concern about the increased involvement of institutional buyers – including some from the “shadow banking” sector – in the country’s property market. Private equity firms and specialised investors have spent the years since the financial crisis buying distressed real estate, often with the intention of converting them into more lucrative rental properties. While interest from institutional buyers has helped US house prices recover in recent years, it has also led to concerns about the financial companies’ ability to act as effective landlords for thousands of properties scattered around the country. “We had this vision in our head of a 30-year-old junior banker, driving a Range Rover from house to house, trying to collect rent,” Doug Duncan, chief economist of the government-owned mortgage financier, said at a private industry conference last week. “We didn’t necessarily see that as a sustainable [business] model.” Mr Duncan said that retreating institutional buyers could eventually contribute to a drop in house prices in certain US markets, if they begin selling off their property portfolios at the same time that housing builders begin to ramp up their activity.
These 10 People Collectively Own 33 Million Acres, Or 1.5% Of All US Land -- It is a well-known fact that when it comes to ownership of rental properties in the US, Wall Street, and particularly Blackstone, has become the single largest landlord in the country. But what about undeveloped land? As summarized by Vizual-statistix, according to The Land Report published by Fay Ranches, the top 100 owners of US land collectively have 33 million acres in their private holdings. This equates to about 1.5% of all USA land – that may seem like a small percentage, but it’s actually a massive area. The chart below lays out the top 10 largest private landowners with the areas of Puerto Rico, Delaware, Rhode Island, and Washington, D.C. included for scale. As can be seen, all of the top 10 own a piece of the USA that is bigger than Rhode Island, and five have a piece that is at least as big as Delaware. John Malone, who is the largest land owner in the country with 2.2 million acres, owns private property the size of Puerto Rico.
NMHC Survey: Apartment Market Conditions Softer in Q4 - From the National Multi Housing Council (NMHC): Apartment Markets Soften Slightly According to NMHC Survey Apartment market conditions weakened a bit in January compared with three months earlier. The market tightness (41), sales volume (41) and debt financing (42) indexes were all a little below the breakeven level of 50, although the equity financing index rebounded to 50.. “At least half of our respondents to each of our four main questions reported conditions as unchanged from three months earlier. Although markets are a little looser than in October, this is largely seasonal; overall markets remain fairly tight. The Market Tightness Index declined to 41 from 46. Slightly more than half (56 percent) of respondents reported unchanged conditions, and approximately one-third (31 percent) saw conditions as looser than three months ago. The index last indicated overall improving conditions in July 2013. Some respondents noted that the decline was typical for this time of year and that conditions remain fairly tight.
NAHB: Builder Confidence declines to 56 in January - The National Association of Home Builders (NAHB) reported the housing market index (HMI) was at 58 in January, up from 58 in December. Any number above 50 indicates that more builders view sales conditions as good than poor. From the NAHB: Builder Confidence Slips One Notch in January Builder confidence in the market for newly built, single-family homes fell one point to 56 in January from a revised December reading of 57 on the National Association of Home Builders/Wells Fargo Housing Market Index (HMI), released today. ... All three HMI components declined in January. The index gauging current sales conditions edged one point lower to 62, while the index gauging expectations for future sales fell two points to 60. The index gauging traffic of prospective buyers fell three points to 40. Looking at the three-month moving averages for regional HMI scores, the Northeast and West each rose four points to 42 and 63, respectively, while the South held steady at 56. The Midwest fell a single point to 58. This graph show the NAHB index since Jan 1985.
Is The Falling Rate Of Personal Income Growth A New Risk Factor? --Friday’s weak jobs report has taken some of the air out of the optimism balloon for the US macro outlook, but in the search for things to worry about I’m more inclined to focus on the discouraging trend of late with personal income. To be precise, the decelerating year-over-year change in personal income less transfer receipts (Social Security checks, for instance) is beginning to look troubling. It may turn out to be noise, as an earlier dip proved to be. But we’re again entering a phase when there’s minimal room for disappointing numbers with the monthly reports on personal income. The data on payrolls, by contrast, still looks relatively strong for the critical year-over-year comparisons. I don’t want to overplay the potential for trouble with the personal income numbers, at least not yet. As Doug Short reminds, the quirks in the government’s calculation for income may be distorting the trend at the moment. Keep in mind that the statistical twists may get worse before they get better. Taken at face value, however, the 1.2% annual rise in real personal income less transfer receipts is sharply lower vs. previous months and so this indicator is running out of road. Income growth, of course, is a bedrock for a healthy economy, particularly in the US, where consumer spending is such a big piece of economic activity. Given the soft data on this front lately, the next release of personal income numbers on January 31 deserve close attention. Unfortunately, year-end seasonal issues related to taxes and other complications may leave us no more the wiser about the true trend on this front.
Underconsumption, Income, Wealth, and Capital Gains --I’m rather devastated to find a discussion I missed at Winterspeak’s place from mid-December, with some of my favorite commenters going after the underconsumption argument that I’ve been going on about. It starts by citing Mark Sadowski’s comment from Interfluidity “clarifying the difference between wealth and income.” I found that rather puzzling at first because the first-blush, obvious difference between the two is that one’s a flow and one’s a stock. Duh. But I figured out that he’s actually distinguishing between income and capital gains, making the well-known point that in the language of national accounts, capital gains aren’t income.I’d like to address two points here:
- 1. I think JKH would say that this is all as it must be — that it’s conceptually incoherent to think of capital gains as income. I understand why he would say that. But I’d like to push back on that.
- 2. Sadowski says “In underconsumption theory recessions and stagnation arise due to inadequate consumer demand relative to the production of new goods and services.”
That may be true. But I would suggest that underconsumption theory is not nearly so standardized — that in fact it’s wildly un(der)theorized. (I do wish [liberal] economists would get on this hobby horse…)
More Detailed Data on Income, Growth and Spending Coming This Year - The Commerce Department will roll out several new reports this year to measure the U.S. economy with more detail at the local and industry level.The Bureau of Economic Analysis, a unit of the Commerce Department, in April will unveil for the first time a quarterly report on industry-level gross domestic product, which is the broadest snapshot of all goods and services produced in the U.S. The figures will show how much economic activity is generated by each sector, as well as how much individual industries contributed to overall U.S. growth, the agency said in a statement. Previously, the data was only available annually. The report will cover the first quarter of 2005 to the fourth quarter of 2013, as well as annual figures for 2013. In August, BEA will release state-level GDP data on a quarterly basis. (It’s now released annually.) The report will cover the first quarter of 2007 through the fourth quarter of 2013. “These statistics will offer a more up-to-date picture of how states’ economies are faring,” the agency said. “The statistics will also serve as a better barometer for potential turning points for the overall U.S. economy.” The BEA also plans to release expanded personal income and consumer spending measurements this year.
95% Of ATMs Are Still Using Windows XP. No, Really - Who is still using Windows XP, an operating system which is now twelve years old? Other than “everyone’s mom,” the real answer might not be as obvious: the nation’s network of automated teller machines. ATMs all contain computers, of course. Computers are susceptible to malware. Systems running Windows XP may be more susceptible to malware after April 8 of this year, when Microsoft finally ends support and security patches for XP. Don’t worry: it’s unlikely that the machines will start setting your savings account on fire anytime soon. Yet it boggles the mind to learn that 95% of ATMs in the world run on Windows XP. Still. That number won’t decrease very much after the deadline: one expert told Bloomberg Businessweek that maybe 15% would be upgraded by the deadline. That’s not as wacky as it sounds: companies can literally buy more time, since they can pay for extended support directly from Microsoft for computers that still run XP. J.P. Morgan Chase chose to do this, and will upgrade their machines to Windows 7 sometime next year. Some computers will be exempt, since they run a version of the operating system, Windows XP Embedded, that’s less susceptible to viruses and also will still have Microsoft’s support until 2016.
U.S. Retail Sales Inch Up, But Holiday Spending Weak — Americans bought more clothing in December, clicked frequently at online retailers and paid higher gas prices. They cut back on cars and almost everywhere else, providing a lackluster end to the holiday shopping season.Retail sales rose just 0.2 percent last month, the Commerce Department said Tuesday. That follows strong gains in October and November, helped by healthy auto sales.In December, car and truck sales fell 1.8 percent due to colder weather and Black Friday discounts that moved some sales into November. The decline held back overall retail spending that did show some signs of underlying strength. Excluding spending on autos, gas and building supplies, retail sales rose a solid 0.7 percent. Economists say this figure is a better proxy for confidence in the economy, because it does not include the most volatile categories. The report showed less spending at traditional holiday outlets. But the December gain should be enough to help generate 3 percent annualized growth in the final three months of 2013, said Paul Dales, senior U.S. economist at Capital Economics.
December Advance Retail Sales Beat Expectations - The Advance Retail Sales Report released this morning shows that sales in December came in at 0.2% month-over-month, a decline from November's 0.4% (a downward revision from 0.7%). Today's headline number came slightly above the Investing.com forecast of a 0.1% gain. Core Retail Sales (which excludes Autos) were up 0.7%. That was an improvement from last month's 0.1% (a downward revision from 0.4%) and better than the Investing.com forecast of 0.4%. The first chart below is a log-scale snapshot of retail sales since the early 1990s. I've included an inset to show the trend in this indicator over the past several months. Here is the Core version, which excludes autos. Here is a year-over-year snapshot of overall series. Here we can see that the YoY series is off its peak in June of 2011 and has been relatively range-bound since April of last year.Here is the year-over-year performance of at Core Retail Sales. Here is an overlay of Headline and Core Sales since 2000.
Retail Sales increased 0.2% in December - On a monthly basis, retail sales increased 0.2% from November to December (seasonally adjusted), and sales were up 4.7% from December 2012. Sales in November were revised down from a 0.7% increase to 0.4%. From the Census Bureau report: The U.S. Census Bureau announced today that advance estimates of U.S. retail and food services sales for December, adjusted for seasonal variation and holiday and trading-day differences, but not for price changes, were $431.9 billion, an increase of 0.2 percent from the previous month, and 4.1 percent (±0.7%) above December 2012. ... The October to November 2013 percent change was revised from +0.7 percent to +0.4 percent.This graph shows retail sales since 1992. This is monthly retail sales and food service, seasonally adjusted (total and ex-gasoline). Retail sales ex-autos increased 0.7%. The second graph shows the year-over-year change in retail sales and food service (ex-gasoline) since 1993. Retail sales ex-gasoline increased by 4.6% on a YoY basis (4.1% for all retail sales). The increase in December was above consensus expectations, but was close including the downward revision to November.
Retail Sales Up A Mild 0.2% In December - Retail sales rose again last month--the ninth consecutive month of higher spending. But December's advance was the slowest since September. The headline figure was pulled down by a sizable slump in auto sales. Excluding motor vehicles, retail spending advanced 0.7% in December over the previous month. Looking past the monthly noise, the broad trend via the year-over-year comparison reveals that moderate growth prevails. For perspective, let’s start with the monthly numbers. As the first chart shows, December spending turned sluggish vs. October and November. Excluding gasoline sales, retail sales posted the slowest monthly advance since March.Turning to the annual view, however, suggests that nothing much has changed for retail spending. Consumption through December was higher by 4.1%, a touch lower than November’s 4.2% gain. It’s fair to say that retail spending remains stable at just over the 4% mark. That’s near the lower end of the annual rates of change we’ve seen in recent years and so there’s minimal room for disappointment going forward. But for now, the trend still looks mildly encouraging. The bottom line: consumer spending isn’t a problem for the economy at this point. By contrast, the income side of personal finances looks a bit wobbly, as I discussed yesterday. Ultimately, personal spending and income are bound at the hip. On that note, we’ll now more when the government publishes the December personal income data on January 31.
Retail Sales Up 0.2% for December as Holiday Sales Grow By 3.8% - December 2013 Retail Sales increased 0.2% for the month on groceries, booze, gas and clothing. Retail sales have now increased 4.1% from a year ago. Electronics & Appliances tanked with their sales down -2.5% for December. Auto sales plunged -1.9% from the previous month, but that's OK, they are still up 6.2% for the year. Holiday sales increased 3.8%, a fine showing of more consumerism in America. Retail sales are reported by dollars, not by volume with price changes removed. Holiday sales are retail sales for November and December, minus sales from auto dealers, gas stations, restaurants and bars. Holiday sales increased 3.8% from last year, an amazing showing actually due to the shorter buying spree time period. Expecting people to buy more when their wages are flat and the real economy is still terrible is becoming a Wall Street absurdity. Obviously reports of holiday sales being down are wrong. The reality is online shopping is really starting to kick the @*!# out of traditional stores. While stores claimed foot traffic was down over 22%, very obviously they are not paying attention to smartphone signals, shopping apps and website analytics. Retail trade sales are retail sales minus food and beverage services and these sales also increased 0.2% for the month.. Retail trade sales includes gas. Retail sales without gasoline purchases increased 0.1% for the month. Gasoline station sales are back up 0.6% from one year ago, but for Q4 are down -0.8% in comparison to Q3 Total retail sales are $431.9 billion for December. Below are the retail sales categories monthly percentage changes. These numbers are seasonally adjusted. General Merchandise includes super centers, Costco and so on. Online shopping making increasing gains, increasingly important in overall retail sales. Online shopping continues on it's drone like soar as nonstore retail sales have increased 9.9% from last year.
December Retail Sales Beat Due To November Revision Lower, Electronics Sales Tumble - Following ongoing promises from the Fed that the Taper will continue at a pace of $10 billion per month come rain or shine, suddenly good news are critical for stocks, as the stock market is desperate for a strong economy to which Yellen can pass the baton. It did not get that with Friday's payrolls number so it was hoping for some good news in today's retail sales. And judging by the market response to the just released December retail sales, it got it, if only for now: headline December retail sales rose 0.2%, on expectation on a 0.1% increase even as auto sales tumbled -1.8%. Retail Sales ex autos rose 0.7% higher than the 0.4% expected, while ex autos and gas was up a more modest 0.6%, also better than the 0.3% expected. How is it possible that December retail sales according to the US government were better than expected, when every retailer has posted abysmal results? Well it seems the Census Bureau merely engaged in some recalendarization, with November numbers all revised substantially lower: headline down from 0.7% to 0.4%, ex autos 0.4% to 0.1%, and ex autos and gas from 0.6% to 0.3%. In other words, a complete wash with today's "beat." So when netting away the calendar effect of an early start to the holiday season, perhaps the only value added data in the retail sales report was the data involving Electronics and Appliance Stores.They posted the biggest 2 month drop in 2 years!
December Real Retail Sales Worse Than Headline Number -- The retail sales headline number for December rose 0.2%, beating the market consensus of a flat month. As usual, the featured number was a seasonally adjusted, made up number, also not adjusted for inflation. The mainstream media noted the solid gain, but worried about the inventory buildup. However, the actual numbers, not seasonally finagled, the revealed that December was actually a subpar month. I looked at the not seasonally adjusted actual sales, then adjusted for inflation and also excluded gas sales because gas sales act as a counterweight based on gas price changes. Gas prices are volatile and sometimes have a small, but misleading effect on total sales. When gas prices rise it adds to nominal retail sales but people often buy less of it along with buying less of everything else, making the rise in sales misleading. When gas prices fall, it looks like a fall in retail sales when the price drop actually stimulates other retail spending because it puts money back in consumers’ pockets. Here’s what nominal not seasonally adjusted retail sales look like versus the same series excluding gas sales. Nominal retail sales, not adjusted for inflation, rose 4.3% year to year. That was in line with the average 4.2% annual gain over the past 12 months. However, the month to month rise of 13.2% was below average for December. The average December gain over the previous 10 years was 16.3%. Real retail sales ex gasoline were up just 2.8%. The top 10% of the income spectrum and foreign shopping tourists continue to boost those numbers to well above the income gains for the bulk of US consumers. In spite of that, the year to year gain was below the average yearly gain of 3% for the prior 12 months. The month to month gain of 14.4% was well below average for December. The 10 year average December increase was 18.2%. Once again the headline number made things look better than they really were. December retail sales were actually below average. Perhaps the December weather can be blamed. We’ll need to see if sales bounce back when the weather improves.
Vital Signs: Consumers Didn’t Go Overboard on Gift Buying - Ahead of Tuesday’s retail sales report comes word that the vast majority of U.S. consumers—usually not the paragons of restraint—kept within their holiday budgets in 2013. According to a survey by personal-finance website Bankrate.com, 57% of consumer said they spent what they planned during the 2013 holiday season, a bit better than the 54% saying that in 2012. Another 26% said they managed to spend less, while only 14% spent more than expected. The survey shows 23% of high-income households (those with annual household incomes of $75,000 or more) spent more this holiday season. That “budget-be-damned” attitude may reflect the recent gains in the stock-market wealth which generally accrues more to high-income families. Indeed, Bankrate.com said among those who earned $75,000 or more, 45% said they felt better about their financial situation now, while only 19% for those who earned $30,000 or less said they felt better compared to a year ago. Economists expect last month’s retail sales increased a mere 0.1%, but that reflects a drop in vehicle sales. Excluding autos, sales are forecast to be up a healthier 0.4%. But if gift-buyers managed to stick within their budgets, December retail receipts might disappoint.
Vital Sales: Retailers See Sales and Inventories Rise in Fourth Quarter -- The Commerce Department reported Tuesday that retail sales increased in each month of the last quarter (although the October and November gains were not as strong as reported earlier). Vehicle demand lifted the top-line number, but even outside of car dealerships, sales looked solid. Economists at Credit Suisse estimate real consumer spending grew at a 3.6% annual rate, “on track for the best quarterly performance in three years.” Even with consumers out spending, the retail sector as a whole is holding more inventory. In November, retail stockpiles rose a large 0.8%, and the October levels were revised higher. The inventory-sales ratio (the amount of months it would take to sell out all inventory) held at 1.43 and has been trending higher since early 2012. Although the ratio has come down from its lofty recession levels, the uptrend could signal retailers had too much merchandise on hand at the end of 2013. That would mean less ordering of new goods in 2014. The most troublesome buildup has been in general merchandise stores, including department stores. That inventory-sales ratio has increased from 1.44 in November 2012 to 1.51 in November 2013. And with sales at these stores up only 0.1% in December, it is unlikely their inventories were drawn down last month.
Where Did Consumer Spend Their Money in December? - Retail sales in December increased 0.2% from a month earlier, but the gains weren’t evenly spread. Traditional holiday retailers, such as department stores, electronics and sporting-goods stores, all saw declines from the prior month, adjusting for seasonal variations. Weak auto sales also dragged on the overall number. But that weakness was offset by a strong jump in food and beverage sales, combined with a gain for nonstore retailers, which include online only sellers such as Amazon.Click for full interactive graphic.
Michigan Consumer Sentiment: January Doldrums - The University of Michigan Consumer Sentiment preliminary number for January came in at 80.4, a decline from the 82.5 December final. Today's number is lower than the Investing.com forecast of 83.5. The index is now 4.7 points below its interim high in July of last year. See the chart below for a long-term perspective on this widely watched indicator. I've highlighted recessions and included real GDP to help evaluate the correlation between the Michigan Consumer Sentiment Index and the broader economy. To put today's report into the larger historical context since its beginning in 1978, consumer sentiment is now 6 percent below the average reading (arithmetic mean) and 4 percent below the geometric mean. The current index level is at the 35th percentile of the 433 monthly data points in this series. The Michigan average since its inception is 85.1. During non-recessionary years the average is 87.5. The average during the five recessions is 69.3. So the latest sentiment number puts us 11.1 points above the average recession mindset and 7.1 points below the non-recession average. It's important to understand that this indicator is somewhat volatile with a 3.1 point absolute average monthly change. For a visual sense of the volatility here is a chart with the monthly data and a three-month moving average.
Consumer Confidence Slides, Misses By Most In 8 Years - Following December's biggest-surge-in-4-years for UMich consumer confidence (though a miss), UMich data has fallen back to 80.4 - missing expectations by the biggest margin in 8 years. This is the 4th miss in the last 5 months as hope for moar multiple expansion begins to fade. Both current conditions and the outlook indices fell (for the first time sicne October). As UPS would says, confidence dropped because there was too much confidence...
The Next Tire To Drop On The US Economy - Wolf Richter - Auto sales in the US have been hopping for the last few years, and production has soared, and exuberance along with it, and there were even hopes that sales would soon be where they’d been before the crisis, before the bankruptcies, the plant closures, the job destruction, the bailouts. Through August, it looked like it could happen. August sales hit a seasonally adjusted annual rate (SAAR) of 16.09 million new vehicles (Motor Intelligence), which is close to where sales had been before the crisis. The auto industry plays an outsized role in the US economy, in manufacturing, services, and retail (accounting for nearly 20% of total retail sales). Booming production and sales have been pushing economic growth when hardly anything else was. Then came September and October and the government shutdown and the taper or whatever, and the SAAR dropped to just over 15 million vehicles in both months, and unsold inventories piled up. . It would be just a blip. Sure enough, in November, sales jumped to a rate of 16.4 million units, and everyone breathed a sigh of relief: there’d be no slowdown; the party would go on. Then the December debacle happened. Inventories were already high when sales dropped to a SAAR of 15.4 million vehicles. It brought actual sales for the year down to 15.6 million units. This time they blamed the snowstorms and the polar vortex and whatever, and true, no one in his or her right mind goes out to buy a car during a snow storm, but snowstorms happen every winter, and the weather was beautiful in other parts of the country, including much of the West Coast.
Has the Developed World Hit “Peak Car Use”? - I wrote late last year how Americans appear to be losing their luster for cars, driving less, obtaining fewer licenses, and using less gasoline. The below charts from The Atlantic illustrate the situation nicely, suggesting that the US might have hit “peak cars”. First, at the height of the housing bubble, there were just over two registered cars on the road per household, whereas as at 2011, there were just under two:Second, due to the rising population, the total number of vehicles on US roads has started rising again, although families are obviously not buying as many vehicles as the bubble years: Third, the average number of miles traveled has fallen 9% since the mid-2000s peak: With total vehicle miles also lower, despite the growing population: Finally, you would have to go back to the Reagan era to see annual fuel consumption this low on a per-driver basis: An article published over the weekend in The Guardian provided some analysis of what’s afoot in the US, with young people in particular increasingly shunning car use: New car purchases by those aged 18-34 dropped by 30% in the US between 2007 and 2012, according to the car shopping website Edmunds.com. Many American under-35s are now not even getting their licence. Given that so called “millennials” – those born between 1983 and 2000 – are now the largest generation in the US, the trend is worrying car firms. Meanwhile the number of miles driven by Americans each year has also started to drop –they now drive fewer miles per capita than at the end of Bill Clinton’s first term, according to a report released last year by US PIRG Education Fund. And the age group showing the biggest decline? Those aged 16 to 34, who drove 23% fewer miles on average in 2009 than in 2001.
Producer Price Index: YoY Headline Inflation Rises for the Second Month - Today's release of the December Producer Price Index (PPI) for finished goods shows a 0.4% month-over-month increase, seasonally adjusted, in Headline inflation. Today's data point matched the Investing.com forecast. Core PPI rose 0.3% from last month, topping the Investing.com forecast. Year-over-year Headline PPI is at 1.23%, but that's a 0.92% increase from its 0.30% reading just two months ago. The YoY 1.41% Core PPI is a slight rise from last month's 1.31%. Here is the essence of the news release on Finished Goods: Leading the December rise in the finished goods index, prices for finished energy goods increased 1.6 percent. Also contributing to the advance, the index for finished goods less foods and energy moved up 0.3 percent. By contrast, prices for finished consumer foods decreased 0.6 percent. Finished energy: Prices for finished energy goods climbed 1.6 percent in December, the largest advance since a 2.5-percent jump in June 2013. Over half of the rise in December can be traced to a 2.2-percent increase in the gasoline index. Higher prices for diesel fuel and home heating oil also were factors in the advance in the finished energy goods index. (See table 2.) Finished core: The index for finished goods less foods and energy moved up 0.3 percent in December, the largest advance since a 0.5-percent rise in July 2012. Nearly half of the December increase is attributable to prices for tobacco products, which climbed 3.6 percent. Higher motor vehicle prices also contributed to the advance in the finished core index. Finished foods: The index for finished consumer foods fell 0.6 percent in December following no change in November. Leading the decrease, prices for fresh and dry vegetables dropped 13.4 percent. More... Now let's visualize the numbers with an overlay of the Headline and Core (ex food and energy) PPI for finished goods since 2000, seasonally adjusted. Now, in the last quarter of 2013, the YoY rate is approximately the same as in mid-2010. The more volatile Headline number is fractionally off the bottom of its range since the early months of the recovery from the Great Recession.
Producer Prices Jump Most Since June, Over Half Of Core Increase Due To Tobacco Prices - Following October and November's disturbing declines in Producer Prices, which many misread as an indication that the Fed will delay tapering for a few months, today's PPI reversed the recent drop, and posted a 0.4% jump for the headline number in line with expectations, following two months of declines and the highest print since June's 0.6% sequential increase. And while the Foods PPI dropped by 0.6% in December, Energy prices jumped by 1.6% once again the highest monthly increase since June. But it was the core increase of 0.3%, the highest jump since July 2012 that caught everyone's attention. So is inflation finally seeping back in the production channel? Not really: as the BLS reported, "Nearly half of the December increase is attributable to prices for tobacco products, which climbed 3.6 percent." So bad inflationary news for smokers. For everyone else (who eats and drives hedonically) the status quo still remains. Still at a 1.2% increase in headline PPI, compared to expectations of 1.1%, and November's 0.7%, this was the first beat in annual producer price inflation expectations since June, and means that this data point will not deter the Fed from tapering more as it has warned it will likely continue to do.
Headline Inflation Ticks Up to 1.50% YoY, Core Inflation Is Unchanged at 1.72% - The Bureau of Labor Statistics released the latest CPI data this morning. Year-over-year unadjusted Headline CPI came in at 1.50%, which the BLS rounds to 1.5%, up from 1.24% last month (rounded to 1.2%). Year-over-year Core CPI (ex Food and Energy) came in at 1.72% (rounded to 1.7%), unchanged from last month. Here is the introduction from the BLS summary, which leads with the seasonally adjusted data monthly data: The Consumer Price Index for All Urban Consumers (CPI-U) increased 0.3 percent in December on a seasonally adjusted basis, the U.S. Bureau of Labor Statistics reported today. Over the last 12 months, the all items index increased 1.5 percent before seasonal adjustment. Advances in energy and shelter indexes were major factors in the increase in the seasonally adjusted all items index. The gasoline index rose 3.1 percent, and the fuel oil and electricity indexes also increased, resulting in a 2.1 percent increase in the energy index. The shelter index rose 0.2 percent in December. The indexes for apparel, tobacco, and personal care increased as well. These increases more than offset declines in the indexes for airline fares, for recreation, for household furnishings and operations, and for used cars and trucks, resulting in the index for all items less food and energy rising 0.1 percent. The food index rose slightly in December, increasing 0.1 percent. The food at home index was unchanged for the third time in four months, as a sharp decline in the fruits and vegetables index offset other increases. The food index has not posted a monthly increase larger than 0.1 percent since June. The all items index increased 1.5 percent over the last 12 months; this is an increase over the October and November 12-month changes of 1.0 percent and 1.2 percent, respectively. The index for all items less food and energy has risen 1.7 percent over the last 12 months, the same figure as for the 12-month changes ending September, October, and November. More... The first chart is an overlay of Headline CPI and Core CPI (the latter excludes Food and Energy) since 1957. The second chart gives a close-up of the two since 2000.
Inflation Low In Spite of Rising Rent and Gas Prices - The Consumer Price Index increased 0.3% for December as the price of gas increased 3.1% and the cost of housing oneself is on the rise. CPI measures inflation, or price increases. This is the highest monthly increase in six months, yet for the year inflation is low. Overall energy costs increased 2.1% in December where price increases are needed least. CPI has only increased 1.5% from a year ago as shown in the below graph. This is a low annual rate of inflation and believe this or not, deflation can really harm an economy. Taking together 2013's 1.5% and 2012's 1.7% annual inflation rate, this is the lowest two years in a row annual inflation increase since 1997-1998. The year 2013 by itself is much lower than the last 2.4% ten year inflation average as well. Core inflation, or CPI with all food and energy items removed from the index, increased 0.1%. Core inflation has risen 1.7% for the last year. Since June 2011 core inflation has ranged from 1.6% to 2.3% and the ten year average is 2.0% core inflation . Core CPI is one of the Federal Reserve inflation watch numbers and 2.0% per year is their target. Graphed below is the core inflation change from a year ago and here the deflationary bad juju of the recession is clearly displayed. Core CPI's monthly percentage change is graphed below. Energy overall shot up by 2.1%, yet energy costs are still low, up 0.5% for the year. This is very low in comparison to the 5.9% ten year average energy inflation rate and this is with 2012 also having an annual 0.5% energy inflation rate. The BLS separates out all energy costs and puts them together into one index. This index includes gasoline which dropped increased 3.1% for the month and has declined -1.0% for the entire year. Electricity has increased 0.4% for the month and 3.2% for the year. Fuel oil is still down -1.8% from a year ago yet for December shot up by 2.4%. Natural gas is now down -1.0% from a year ago after a monthly decline of -0.4%. Energy costs are also mixed in with other indexes, such as heating oil for the housing index and gas for the transportation index. Below is the overall CPI energy index, or all things energy. Note the speculative bubble of 2008, something the economy assuredly does not need to see again.
Prescription Drug Price Plunging By Most On Record Keeps Tepid Inflation In Line With Expectations - If yesterday's rising PPI print suggested the Fed may continue its $10 billion a month taper at its next meeting, today's comparably rising CPI for December will likely mean that absent another payroll-like shock, the Fed will soon monetize "only" $65 billion per month. The reason: in December core consumer inflation rose by 0.3%, compared to the 0.0% change in November, and in line with expectations. Stripping away food and energy however, the increase was only 0.1%, also in line with expectations, and a decline from November's 0.2% increase. More importantly, on a Y/Y basis, core CPI was up by 1.7%, still shy of the Fed's 2% target but not too far.
Why the data is missing big price hikes - These days, prices for a number of goods and services have suddenly begun to rise. Some are obvious, others are not. But most of them appear to be escaping the government’s number-crunchers, when it comes to showing up in its various price indexes. You see, there are several ways that a provider of goods or services can raise prices. Not all are obvious at first blush — but all will have an impact on your buying power before long. First there is the outright change in price tags. This usually gets picked up by the government’s statisticians. Look for them in this week’s consumer and wholesale price indexes. Then there are fees and surcharges. These are usually slipped into your monthly bill by your insurance company, your phone and cable provider, and your local utility. These masquerade under the term “government mandated,” but are they really required? You be the judge. The third method is more subtle. Instead of raising prices, the seller reduces the size of the product. This is more ubiquitous than you might think. When was the last time you saw a can of ground coffee that actually weighed a pound? Nowadays it’s more like 10 ounces. Check your roll of toilet paper. Chances are it no longer fills up the spool they way it used to. As for candy bars, they are a mere shadow of their former selves. Newspapers are up in price, but at the same time are shrinking in size and content. And can you remember the last time your favorite weekly magazine was 200 pages thick? (Hint: try the 1960s.) Don’t even talk about health care. Obamacare notwithstanding, insurance premiums are soaring, as are co-pays. And who among you can actually decipher a hospital bill?
Dollar stores are now getting too expensive for many Americans – At first glance, the fortunes of American families have significantly improvement recently. Household net worth has rebounded back to roughly where it was before the financial crisis. Why? A surge in stock and real estate prices. The stock market is up 46% since the end of 2010. And after years of pain, housing prices are rising too. But again, the poor are left out.No, the poor rely not on asset prices, but on wages, Social Security, and government transfer payments for their income. That hasn’t been a good place in recent years. Wages have been stagnant. Government transfer payments have been under fire. (Extended unemployment benefits expired late last month for roughly 1.4 million Americans after a federal program lapsed. And it seems like the US Congress is set to cut transfer payments such as the US food stamps program.) Economists argue that things like food stamps and unemployment act as crucial bits of stimulus when the economy is weak. Cutting them can act as a headwind to growth. That’s certainly the case for low-end retailers such as Family Dollar. The store chain’s shares fell sharply this week after it reported disappointing earnings. Family Dollar CEO Howard Levine had this to say on the subject:our core lower-income customers have faced high unemployment levels, higher payroll taxes, and more recently reductions in government-assistance programs. All of these factors have resulted in incremental financial pressure and reduction in overall spend in the market.
Exclusive: More well-known U.S. retailers victims of cyberattacks – sources (Reuters) - Target Corp and Neiman Marcus are not the only U.S. retailers whose networks were breached over the holiday shopping season last year, according to sources familiar with attacks on other merchants that have yet to be publicly disclosed. Smaller breaches on at least three other well-known U.S. retailers took place and were conducted using similar techniques as the one on Target, according to the people familiar with the attacks. Those breaches have yet to come to light. Also, similar breaches may have occurred earlier last year. The sources said that they involved retailers with outlets in malls, but declined to elaborate. They also said that while they suspect the perpetrators may be the same as those who launched the Target attack, they cannot be sure because they are still trying to find the culprits behind all of the security breaches. Law enforcement sources have said they suspect the ring leaders are from Eastern Europe, which is where most big cyber crime cases have been hatched over the past decade. Only one well-known retailer, Neiman Marcus, has said that they too have been victim of a cyber attack since Target's December 19 disclosure that some 40 million payment card numbers had been stolen in a cyber attack. On Friday, Target said the data breach was worse than initially thought. An investigation found that hackers stole the personal information of at least 70 million customers, including names, mailing addresses, telephone numbers and email addresses. Neiman Marcus said it was not sure if the breach was related to the Target incident.
Data Breaches: Target, Neiman Marcus - Let's be really clear about what most identity theft is about: it's about payments data. Identity theft is first and foremost a payments fraud problem. We don't know all of the details about what happened at Target and Neiman Marcus, but there's a really obvious weakspot in the US payments infrastructure that should be corrected, irrespective of whether it would have prevented the Target and Neiman Marcus breaches: the use of two-factor authentication, namely chip-and-PIN cards, which are standard outside the US and have been effective in reducing fraud. Why don't we have chip & PIN here? Because the banks don't want to pay for it because they don't bear most of the fraud costs. The banks/payment networks are the least cost avoider of identity theft, but because merchants are eating most of the fraud costs, the banks have instead have opted for a complex set of security standards for merchants (PCI Security Standards) that are of dubious effectiveness. Chip & PIN cards have two key security features. First, these cards have a microchip inside that frustrates easy physical copying of the cards. With our current mag stripe cards, I can copy the information off the mag stripe with a small reader and then use that to make a new card. Not so easy if I also have to copy the information on a microchip embeded in the card. Second, these cards require a PIN to use. The PIN creates what is called two-factor authentication. The first factor is the information on the card itself (from the chip and mag stripe). The second factor is the PIN. Thus, even if my card is stolen, the card isn't useful without the PIN. Chip and PIN isn't impossible to crack, but it is a lot harder. And that's the name of the game in identity theft.
Target Confirms Point-of-Sale Malware Was Used in Attack - According to Target Chairman and CEO Gregg Steinhafel, point-of-sale (POS) malware was used in the recent attack that compromised millions of credit and debit card account numbers of customers across the country. Steinfhafel told CNBC’s Becky Quick in an interview that malware was used in attacks that compromised the company’s point of sale registers. “While Steinfhafel said the full extent of what transpired is not yet known, what Target does know is that malware was installed on the company' point of sale registers,” Quick wrote Sunday evening.
Target, Neiman Marcus Credit Card Hacking Reveals Third-World US Payment Systems - Yves Smith -- Occasionally, we’ve commented on the shoddy state of US credit card payment infrastructure. One of the noteworthy aspects of the fiasco of recent US retailer security breaches is that the media has more or less ignored the question of what could have been done to forestall these incidents, which in the case of Target involved as many as 70 million customers, and Neiman Marcus, under (but presumably not much under) 1 million.And make no mistake about it, the US is seriously behind world standards. I did a credit card study in 1997 in which I visited 5 continents, specifically countries that were the high end of the third world such as Korea, Costa Rica, and South Africa. Smart cards, also known as chip cards, were the norm in many and were being rapidly adopted in others. Georgetown law professor Adam Levitin, in a new post at Credit Slips, explains the security advantages of these cards: First, these cards have a microchip inside that frustrates easy physical copying of the cards. With our current mag stripe cards, I can copy the information off the mag stripe with a small reader and then use that to make a new card. Second, these cards require a PIN to use. The PIN creates what is called two-factor authentication. The first factor is the information on the card itself (from the chip and mag stripe). The second factor is the PIN. Thus, even if my card is stolen, the card isn’t useful without the PIN. Chip and PIN isn’t impossible to crack, but it is a lot harder. And that’s the name of the game in identity theft. Levitin stresses that the media accounts are making the retailers look like the ones at fault, when the banks are the ones at fault. Very few articles have mentioned the fact that better technology exists and is standard outside the US, and the ones that go there still underplay how far the US is behind and how the banks are driving this bus. Reuters comes closer than most and still misses the banks’ responsibility, starting with the headline, With data vulnerable, retailers look for tougher security:
Neiman Marcus Hack Went Unnoticed for Five Months - Hackers penetrated the internal computer systems of the retailer Neiman Marcus to steal customer credit card information five months before the company learned of the breach, The New York Times revealed Thursday. The company revealed in early January that its systems had been compromised and that customer credit card information was stolen and fraudulently used, but did not reveal when the attack had occurred. “We did not get our first alert that there might be something wrong until mid-December. We didn’t find evidence until January 1,” a spokesperson for the company told Reuters. But sources familiar with the investigation told the Times that the initial intrusion happened as early as mid-July last year, and that the company admitted it had not fully contained the problem until Sunday.
Why American Companies Are Holding Onto $5 Trillion In 'Cash' - People and companies are holding more cash because there is more cash to hold. When financial reporters talk about “cash,” they aren’t referring to Federal Reserve Notes, but to highly liquid, risk free, dollar-denominated assets. Things of this description are what corporate treasurers mean when they use the term, “cash.” The federal government’s “Debt Held by the Public” (DHBTP) can be used as a proxy for the total amount of “cash” (at least, U.S. dollar cash) in the world. Over the past six years, U.S. DHBTP increased by $7.2 trillion, or 140%, to $12.3 trillion. Because this “cash” exists, every time you look, someone, somewhere will be holding it. Mystery solved. Moving right along, financial reporters seem to believe that the presence of large amounts of cash on corporate balance sheets means that the companies aren’t investing, or that they should be investing more. While it is true that real, productive investment is far below the levels needed for robust economic growth, you can’t tell this from the size of corporate cash balances. Investment is “flow.” Cash balances are “stock.” By one accounting, big companies are holding about $5 trillion in “cash.” If they spent all of it tomorrow, the day after tomorrow, these companies’ cash balances would probably total close to the same $5 trillion. This is because, from the point of view of the private economy, cash cannot be created or destroyed; it can only be moved around.
Corporations Have Record Cash: They Also Have Record-er Debt, As Net Leverage Soars 15% Above Its 2008 Peak - There is a reason why activism was the best performing hedge fund "strategy" of 2013: as we wrote and predicted back in November 2012 in "Where The Levered Corporate "Cash On The Sidelines" Is Truly Going", US corporations - susceptible to soothing and not so soothing (ahem Icahn) suggestions by major shareholders - would lever to the hilt with cheap debt and use it all not for CapEx and growth, but for short-term shareholder gratification such as buybacks and dividends. A year later we found just how accurate this prediction would be when as we reported ten days ago US corporations invested a whopping half a trillion in buying back their stock, incidentally at all time high prices. Putting aside the stupidity of this action for corporate IRRs, if not for activist hedge fund P&Ls, another finding has emerged, one that was also predicted back in 2012. Because in addition to still soaring mountains of cash, corporations have quietly amassed even greater mountains... of debt. In fact, as SocGen reveals, net debt, or total debt less cash, has risen to a new all time high, and is now 15% higher than it was at its prior peak just before the financial crisis!
Fed: Industrial Production increased 0.3% in December - From the Fed: Industrial production and Capacity Utilization Industrial production rose 0.3 percent in December, its fifth consecutive monthly increase. For the fourth quarter as a whole, industrial production advanced at an annual rate of 6.8 percent, the largest quarterly increase since the second quarter of 2010; gains were widespread across industries. Following increases of 0.6 percent in each of the previous two months, factory output rose 0.4 percent in December and was 2.6 percent above its year-earlier level. The production of mines moved up 0.8 percent; the index has advanced 6.6 percent over the past 12 months. The output of utilities fell 1.4 percent after three consecutive monthly gains. At 101.8 percent of its 2007 average, total industrial production in December was 3.7 percent above its year-earlier level and 0.9 percent above its pre-recession peak in December 2007. Capacity utilization for total industry moved up 0.1 percentage point to 79.2 percent, a rate 1.0 percentage point below its long-run (1972–2012) average. This graph shows Capacity Utilization. This series is up 12.3 percentage points from the record low set in June 2009 (the series starts in 1967).Capacity utilization at 79.2% is still 1.0 percentage points below its average from 1972 to 2012 and below the pre-recession level of 80.8% in December 2007.The second graph shows industrial production since 1967.
Industrial Production up 6.8% in Q4, yet Capacity Stunted Still - The Federal Reserve Industrial Production & Capacity Utilization report shows a 0.3% increase in industrial production. Manufacturing alone grew, a 0.4% gain for the month, while utilities slid down by -1.4%. Mining was up 0.8%. Industrial production finally surpassed pre-recession levels this month. The G.17 industrial production statistical release is also known as output for factories and mines. The graph below shows industrial production index. Total industrial production has increased 3.7% from a year ago. The press headline claim industrial production has the strongest annual gain since 2010 is false. Really industrial production is just recovering to six years ago 2007 levels for the total index. Currently industrial production is just 0.9 percentage points above December 2007. Below is graph of overall industrial production's percent change from a year ago. The Federal Reserve gives long term averages but economic malaise has been going on so long, 2008-2012 are part of those averages now. Here are the major industry groups industrial production percentage changes from a year ago.
- Manufacturing: +2.6%
- Mining: +6.6%
- Utilities: +7.6%
The 4th quarter for Industrial production is starting to shape up to be not bad, with an overall annualized 6.8 % increase and this is the biggest quarterly gain since Q2 2010. Industrial production does have some very loose correlation to GDP components. Yet, Q4's showing is a positive sign for economic growth. The below graph is the industrial production index by quarters, up to Q4 2013.
As Capacity Utilization Rises To Five Year High, Many Wonder: Just How Much Slack Is There? - The most notable number in today's Industrial production report was the update of Capacity Utilization, which rose once again from 79.1% to 79.2%, 10 basis point higher than expectations. This was also the highest Cap Utilization print since May 2008 and makes a further case that the economic cycle is in its late stages and that slack, contrary to what economists are repeatedly, and incorrectly, claiming is rapidly dropping to the point where it is indeed time to start thinking about the arrival of the next dreaded "R" word.
NY Fed: Empire State Manufacturing Activity indicates faster expansion in January - From the NY Fed: Empire State Manufacturing Survey The January 2014 Empire State Manufacturing Survey indicates that business activity expanded for New York manufacturers, and did so at a faster pace than in recent months. The general business conditions index rose ten points to 12.5, its highest level in more than a year. The new orders index climbed thirteen points to 11.0, a two-year high, and the shipments index rose to 15.5. ...Employment indexes suggested an improvement in labor market conditions. The index for number of employees rose twelve points to 12.2, indicating a modest increase in employment levels, and the average workweek index rose to 1.2—a sign that hours worked held steady.This is the first of the regional surveys for January. The general business conditions index was above the consensus forecast of a reading of 3.3, and indicates faster expansion. The internals were solid too, with new orders at a two year high, and the employment index increasing.
Empire Fed Beats; Spikes To Highest Since May 2012 = After 5 months of missed expectations, Empire Fed manufacturing beat expectations by the most since Feb 2013, spiking to the highest since May 2012. Most sub-indices were positive but it is perhaps worth noting that despite all this exuberance, over 70% of companies expected no improvement in employment and over 80% expected no improvement in the average workweek. While inflation is nowehere to be seen, it is interesting that the Empire Fed's Prices Paid index spiked this month by the most since March 2012. Hope remains that Capex and Tech Spend will pick up as the outlook index rose by the most in 5 months (though remains historically low).
Empire State Manufacturing Surges, Best Reading Since May 2012 -- This morning we got the latest Empire State Manufacturing Survey.. The diffusion index for General Business Conditions dramatically topped expectations, posting a reading of 12.51, up from 2.22 last month. The Investing.com forecast was for 3.75. The Empire State Manufacturing Index rates the relative level of general business conditions New York state. A level above 0.0 indicates improving conditions, below indicates worsening conditions. The reading is compiled from a survey of about 200 manufacturers in New York state. Today's reading is the highest since May 2012. Also, this update incorporates the annual benchmark revision using new seasonal factors. Here is the opening paragraph from the report. The January 2014 Empire State Manufacturing Survey indicates that business activity expanded for New York manufacturers, and did so at a faster pace than in recent months. The general business conditions index rose ten points to 12.5, its highest level in more than a year. The new orders index climbed thirteen points to 11.0, a two-year high, and the shipments index rose to 15.5. The unfilled orders index remained negative at -8.5. The indexes for both prices paid and prices received were significantly higher, pointing to an acceleration in the pace of input and selling price increases. Employment indexes indicated an improvement in labor market conditions. Indexes for the six-month outlook continued to convey a fair degree of optimism about future conditions. Here is a chart illustrating both the General Business Conditions and Future General Business Conditions (the outlook six months ahead):
Vital Signs: New York Fed Gives the Service Sector Some Love -- On Thursday, the Federal Reserve Bank of New York rolled out a new business survey that focuses on the service side of the regional economy. The new survey is a smart move for a region of the U.S. that is more closely connected to finance, tourism, and media than it is to manufacturing. The inaugural report shows the region’s service sector is increasing modestly this month, continuing nearly a year of expansion. Employment levels are holding virtually steady. For now the data are not seasonally adjusted. However, more respondents think the current business climate is worse in January than the number who thinks the climate is better. The business climate index, -7.96 in January, has been negative since 2007, but the report says, ”it has been on a clear upward trend since the end of the national recession.” In addition, the forward-looking indexes are looking up. The expected business activity index increased to a near three-year high of 46.9 in January from 30.97 in December. And the expected business climate index rose to 37.17 from 23.68. Businesses also plan to increase employment in the next six months. The New York Fed’s service survey includes companies in the finance, media, healthcare, education, leisure and hospitality, wholesale distributors and transportation sectors. The areas covered are New York, northern New Jersey and southwestern Connecticut. The report will be released the day after the Empire State survey is released.
Philly Fed Business Outlook: Continued Growth in January, Future Outlook Moderates - The Philly Fed's Business Outlook Survey is a monthly report for the Third Federal Reserve District, covers eastern Pennsylvania, southern New Jersey, and Delaware. The latest gauge of General Activity came in at 9.4, a rise from the previous month's 6.4 (revised from 6.5). The 3-month moving average came in at 8.3, down from 10.4 last month. Since this is a diffusion index, negative readings indicate contraction, positive ones indicate expansion. Today's six-month outlook at 34.4 is a decline from last month's 44.0 (revised from 45.8). Here are the introduction and summary sections from the Business Outlook Survey released today: Manufacturing growth in the region continued in January, according to firms responding to this month's Business Outlook Survey. The survey's broadest indicators for general activity, new orders, shipments, and employment were positive, signifying continued moderate growth. The survey's indicators of future activity moderated but continue to suggest general optimism about growth over the next six months. Summary The January Business Outlook Survey suggests that activity in the region's manufacturing sector increased moderately this month. Firms reported increases in overall activity, new orders, and employment in January. Price increases for firms' own manufactured goods were less widespread this month. The survey's future activity indexes suggest that firms expect growth over the first half of 2014. (Full PDF Report) . The first chart below gives us a look at this diffusion index since 2000, which shows us how it has behaved in proximity to the two 21st century recessions. The red dots show the indicator itself, which is quite noisy, and the 3-month moving average, which is more useful as an indicator of coincident economic activity.
Philly Fed Beats Even As New Order Drop To May 2013 Levels, Inventories Tumble - On the surface, the January Philly Fed was a beat, printing at 9.4 on expectations of a 8.7 number and up from a downward revised 6.4. However, the internals were hardly as pretty with the most notable, New Orders, plunging from 12.9 to 5.1, the lowest print since May 2013, and also the biggest three month drop since August 2011. Additionally, while unfilled orders posted a modest increase from -6.6 to -1.0, Inventories were crushed sliding from 16.0 to -19.6, on what one can assume were wholesale liquidations, and judging by the retailers abysmal numbers, at hardly profitable levels. Furthermore, the optimism of the diffusion index respondents seems to be waning as the 6 Months forecast slide from 44.8 to 34.4 after hitting a recent near all time high of just shy of 60. Also bad news for margins, as Prices Paid increased by 2.3 points to 18.7, while Prices Received decline from 10.8 to 5.1 - a delta, in the wrong direction, of 13.6. The only good news in the report was the increase in number of employees from 4.4 to 10.0, however offset by the average employee workweek which dropped from 4.8 to -5.3. So more workers, doing less: so much for wage inflation pressures.
NSA Spying Fallout Hits French Satellite Deal - Techdirt has already noted how the NSA's massive spying programs around the world are costing US companies money through lost business -- and are likely to cost them even more in the future. But it seems that the fallout is even wider, as this story from The Voice of Russia makes clear: The sale of two intelligence satellites by France to the UAE [United Arab Emirates] for nearly $1bln could go bust after the satellites were found to contain US technology designed to intercept data transmitted to the ground station. A top UAE defence source said that the satellites contain specific US-made components designed to intercept the satellites' communication with their accompanying ground station. As a result, the UAE might do a deal with the Russians instead: An unnamed UAE defence source said that it is not clear if the US equipment can be taken off the French satellites, so the incident has resulted in an increase of talks with Moscow, which, along with Beijing, has also been a frequent defence technology supplier to the Emirates. So it seems likely that not only will US companies find it hard to sell their wares directly to nations that are worried about possible surveillance, but foreign manufacturers will also be reluctant to include certain types of US technology in their own products, since that might cost them contracts. The price being paid by US businesses for the NSA's "collect it all" approach continues to rise.
NFIB: Small Business Optimism Index increases in December -- From the National Federation of Independent Business (NFIB): Small Businesses Optimism Increases in December Small-business optimism ended the year slightly up from November at 93.9, but below the previous 3 mid-year readings of over 94 and 6 points below the pre-recession average, according to the National Federation of Independent Business’ (NFIB’s) latest index. On the positive front, reports of capital spending rose significantly in December, increasing by 9 points from November and job creation among NFIB firms was the best since February 2006. Owners increased employment by an average of 0.24 workers in December, the best reading since February 2006. This graph shows the small business optimism index since 1986. The index increased to 39.9 in December from 92.5 in November. Another positive: During the recession, the single most important problem was "poor sales". The percentage of owners naming "poor sales" has fallen significantly to 14 percent, and small business owners are once again complaining about taxes and government - this is what they complain about in good times!
Wanted: More Worker-Owners - While Professors Blasi, Freeman and Cruse show that a surprisingly large share – 47 percent of full-time wage and salary earners in the United States – enjoy some share of profits, the amount they receive is typically quite small and they are seldom offered much voice in management. Some Republicans as well as Democrats favor policies that could help turn more workers into owners. Representative Dana Rohrabacher, Republican of California, proposes that stock widely distributed to employees should not be taxed as income, and, if held for more than 10 years, should be exempt from capital gains taxation. In a recent Forbes article, Dean Zerbe notes that the larger tax-reform agenda could benefit from more attention to the issue. “Every worker an owner,” he notes, probably invites a more enthusiastic response than “uniformity of depreciation schedules.’ As The Economist noted in November, Britain also has a tradition of worker ownership, including a large and very successful retailer, John Lewis. The Conservative leadership there has taken steps to encourage what they term the “John Lewis economy” with measures including modest tax incentives. Yet The Economist also questions (as do many economists) why government policies should be necessary. Presumably, corporations can figure out on their own if expanding worker ownership is advantageous and move in that direction without the distortionary effects of tax incentives. This makes sense if you assume that corporate behavior is never distorted by any factors except taxes. But considerable evidence suggests this is not the case.
Rebuffing F.C.C. in ‘Net Neutrality’ Case, Court Allows Streaming Deals— Internet service providers are free to make deals with services like Netflix or Amazon allowing those companies to pay to stream their products to online viewers through a faster, express lane on the web, a federal appeals court ruled on Tuesday. Federal regulators had tried to prevent those deals, saying they would give large, rich companies an unfair edge in reaching consumers. But since the Internet is not considered a utility under federal law, the court said, it is not subject to regulations banning the arrangements. Some deals could come soon. In challenging the 2010 regulations at issue in the case, Verizon told the court that if not for the rules by the Federal Communications Commission, “we would be exploring those commercial arrangements.” Internet users will probably not see an immediate difference with their service. Consumer advocates, though, warned that higher costs to content providers could be passed on to the public, and called the ruling a serious blow against the concept of a free and open Internet. “It leaves consumers at the mercy of a handful of cable and phone providers that can give preferential treatment to the content they profit from,” said Delara Derakhshani, policy counsel for Consumers Union.
Net neutrality is dead. Bow to Comcast and Verizon, your overlords - Advocates of a free and open Internet could see this coming, but today's ruling from a Washington appeals court striking down the FCC's rules protecting the open net was worse than the most dire forecasts. It was "even more emphatic and disastrous than anyone expected," in the words of one veteran advocate for network neutrality. The Court of Appeals for the D.C. circuit thoroughly eviscerated the Federal Communications Commission's latest lame attempt to prevent Internet service providers from playing favorites among websites--awarding faster speeds to sites that pay a special fee, for example, or slowing or blocking sites and services that compete with favored affiliates. Big cable operators like Comcast and telecommunications firms like Verizon, which brought the lawsuit on which the court ruled, will be free to pick winners and losers among websites and services. Their judgment will most likely be based on cold hard cash--Netflix wants to keep your Internet provider from slowing its data so its films look like hash? It will have to pay your provider the big bucks. But the governing factor need not be money.
5 Takeaways from December Employment Report - U.S. businesses added 74,000 jobs in December, well below the 200,000 that were forecast. The details also look weak, but the good news is that some of the drag looks temporary and January job growth should bounce back. What can be gleaned from Friday's report:
- 1 Blame Mother Nature - Construction—one of the industries most affected by weather—reported a loss of 16,000 jobs, the first drop since June and the biggest decline since May 2012.
- 2 Less of the population is working or looking for work The unexpected drop in the December jobless rate to 6.7%—the lowest since October 2008—reflects a decline in the number of unemployed. Where did those people go? Less than one-third found work; the rest dropped out of the labor force.
- 3 Health-care hiring takes a sick day - The health-care sector cut 6,000 positions in December. That's the first seasonally adjusted drop since the Labor Department started tracking this sector in 1990, and reflects a sharp slowdown in the unadjusted number of hires—only 1,800 jobs added last month, compared with a 27,000 average in the previous five Decembers.
- 4 Look for a small December income gain - The weak payroll number was accompanied by a shorter work week and little change in hourly pay. The workweek fell six minutes to 34.4 hours in December. Hourly pay for all employees increased only 2 cents, or 0.1%, to $24.17, less than the 0.2% gain forecast. That combination suggests wages and salaries hardly grew last month.
- 5 Jobless rate creates a problem for Fed officials The central bank has said it wouldn't consider raising short-term interest rates until unemployment reaches the 6.5% threshold; now, it's just 0.2 percentage point away. Fed officials know the decline isn't all because of a healthy labor market, and they don't want to start tightening credit too quickly after the jobless rate gets to 6.5%
Number of Americans looking for work at lowest level since 1970s - The recovery in the US jobs market came to a grinding halt in December as businesses added just 74,000 new jobs, the lowest rise since January 2011.The report from the US Department of Labor shocked economists on Friday who had been expecting the number to increase by at least 200,000. The report said the unemployment rate had dropped to to 6.7% in December, but the fall was explained almost entirely by people giving up on their search for work. Only 62.8% of the adult workforce participated in the jobs market in December, down 0.2 percentage points from the previous month. It was the lowest participation rate – the number of people employed or actively looking for work – since the 1970s. The sluggish growth in jobs was surprising. Other reports had indicated strong growth in the market and there are wider signs that the US’s economy is strengthening. The Labor Department even revised up its estimate of jobs growth for November, reporting a confirmed rise of 241,000, up from an initial estimate of 203,000. It said 200,000 jobs were added in October. The retail sector added the most jobs, at 55,000. Jobs were also gained in professional and business services, up 19,000, manufacturing, which added 9,000, and mining, which added 5,000. But weakness in the jobs market spread through a number of industries; information and construction lost jobs, the government shed jobs and in total, the service sector added just 90,000 jobs, well below the previous month’s figure of 175,000.
The Last 2 Times This Happened, The US Was Already In Recession - While the market seems to have rapidly given up worrying about the piss-poor jobs data from last week, the fact of the matter is the longer-term trend of 'employment' in America is anything but questionable. As we pointed out, and was so broadly understood, the number of people in the labor force in American is fading fast. In fact, as the chart below shows, the last 2 times the civilian labor force fell on an annual basis like this, the US economy was already in recession...
Who Is Dropping Out of the Labor Force, and Why? -- Although many economic indicators are heading in a positive direction, last week's December jobs report highlighted the problem of the declining labor force participation rate, the percentage of people aged 16 and over who choose to work or look for work.The labor force participation rate moved back to 62.8 percent from its November level of 63 percent. In 2007, before the recession, 66 percent of Americans were in the labor force. Who is dropping out, and why? A popular view is that labor force participation is declining because older people are retiring. But since 2000 the labor force participation rates of workers 55 and over have been rising steadily, and the labor force participation rates of workers between 16 and 54 have been declining. The labor force participation rate of Americans aged 55 and over has increased by 4.6 percentage points from 2003 to 2013. Both men and women have seen increases in labor force participation rates and employment levels. In contrast, for the 25 to 54 age group, the core group of workers in the labor force, participation rate has declined by 2 percentage points over the same time period, from 83 percent to 81 percent. The biggest decline in labor force participation rates can be observed for workers aged 16 to 24. In 2013, 55 percent were participating in the labor force, compared to 62 percent in 2003, a decline of 7 percentage points. If these young people were increasingly enrolled in school, then declining labor force participation might not be negative. They might be investing in education, resulting in better jobs later on in life. But no, the percentage of 16 to 24 year olds enrolled in high school, college, or university has risen by only three tenths of a percentage point over the past decade, from 56 percent to 56.3 percent.
What Accounts for the Decrease in the Labor Force Participation Rate? - Atlanta Fed's macroblog - Despite the addition of only 74,000 jobs to the economy in December, the unemployment rate dropped significantly—from 7 percent to 6.7 percent. The decline came mostly from a decrease in the labor force. Since the recession began, the labor force participation rate (LFPR) has dropped from 66 percent to 63 percent. Many people have left the labor force because they are discouraged from applying (U.S. Bureau of Labor Statistics data indicate that a little under 1 million people fall into this category). But the primary drivers appear to be an increase in the number of people who are either retired, disabled/ill, or in school. Certainly, the aging of the population accounts for much of the increase in the retired and disabled/ill categories. Still, there has been a lot of movement over the past few years in the reasons people cite for not participating in the labor force within age groups. Knowing the reasons why people have left (or delayed entering) the labor force can help us understand how much of the decline will likely halt once the economy picks back up and how much is permanent. (For more on this topic, see here, here, and here.)The chart below shows the distribution of reasons in the fourth quarter of 2013. (Of the people not in the labor force, 1.6 percent indicate they want a job and give a reason for not being in the labor force. They are categorized here as "want a job" only.) Young people are not in the labor force mostly because they are in school. Individuals 25 to 50 years old who are not in the labor force are mostly taking care of their family or house. After age 50, disability or illness becomes the primary reason people do not want to work—until around age 60, when retirement begins to dominate.
Pathetic December Job Numbers Proof 2014 to Be Challenging Year: The Bureau of Labor Statistics (BLS) reported on Friday that only 74,000 jobs were added to the U.S. economy in December. Most economists were expecting 200,000 jobs to be created in December -- way off reality. The December increase in U.S. payrolls was the slowest pace in almost three years. But it gets worse... The underemployment rate, which I consider the "real" measure of the jobs market in the U.S. economy, was unchanged in December at 13.1%. The underemployment rate includes those people who have given up looking for work and those people who have part-time jobs but want full-time jobs. The table below shows the official unemployment rate versus the underemployment rate for 2013. What the above chart shows is that despite what we heard about the U.S. economy improving in 2013 and despite the Federal Reserve creating over $1.0 trillion in new money in 2013 to help the economy, the "real" unemployment rate declined by less than 10% in 2013, from 14.4% at the beginning of the year to 13.1% by the end of the year. The number of unemployed people in the U.S. stands at a still-staggering 10.4 million.Of the 74,000 new jobs created in December in the U.S. economy, 55,000 jobs were in the low-paying retail trade. Despite what they tell us about the housing market rebound, construction jobs in the U.S. economy declined by 16,000 in December.
The 2013 Employment Story: Yet Another Year of McJob Growth - Since the recession, the U.S. labor market has been nothing if not consistent. While the number may be slightly revised, it appears the country added 182,000 new jobs per month in 2013—about the same as the 183,000 per month we added in 2012 and the 175,000 per month we added per month in 2011. The mildly good news is that, at the rate we're going, the U.S. will have recaptured all of the jobs it lost during the recession before the end of next year. The bad news is that we've added lots of workers to the labor force during that time. Full employment is still a very distant daydream. That says nothing, of course, about the quality of jobs we've been adding. The recession demolished middle-wage industries like manufacturing and construction. What replaced those jobs last year? The leading industry were administrative services, leisure and hospitality, and retail, as shown below. But if you drill down a little further into the numbers, three specific industries combined for almost 43 percent of all job growth this year: temp services (11.3 percent) food services and drinking places, aka restaurants and bars (14 percent), and retail (17.4 percent). Manufacturing and construction combined made up less than 10 percent.
Will the Real Unemployment Rate Please Stand Up? - Obviously, the main problem with high unemployment right now is the joblessness for those looking for work and those who’ve given up for lack of opportunity, along with the absence of wage pressures for the millions of active workers who depend on tight labor market for the bargaining power they otherwise lack. But there’s another big problem, one that’s more technical in nature: what is the unemployment rate? If your answer is 6.7% as per the Bureau of Labor Statistics, you’re low-balling it. Because of the sharp decline in the labor force in recent years, that number provides a downwardly biased take on labor market slack. Estimating the magnitude of that bias happens to very important, because the tautness of the labor market as measured by the unemployment rate is a key policy input both at the Federal Reserve and Congress.For example, the Fed has signaled that they view 6.5% as the jobless rate at which they’ll start thinking about raising the federal funds rate (the key interest rate they set to raise or lower the cost of borrowing; it’s been near zero for years). Well, if you believe the BLS number, they’re almost there. But if you think the official rate is biased down, the Fed is still some ways away from that target. (To be clear, none of this a criticism of the BLS, one of my personal favorite agencies.). But something’s missing: a term to reflect the gap in labor force participation. That is, there’s considerably more slack in the job market than u – u* reveals, because a bunch of potential workers have given up looking for work and are thus not counted in ‘u.’ Another way of saying this is that u is biased downward. If that bias amounts to, e.g., 2% of the labor force, then u – u* should really be 8.7-5.5, or 3.2 ppts.
Isn’t Unemployment an Inadequate Measure of Slack? - I’ve written pretty copiously of late on how the current unemployment rate is unusually uninformative about the current weakness of the job market. Due to many potential job seekers leaving the labor market—and the fact that you’re only counted in the jobless rate if you’re looking for work—it’s biased down. In my estimation, the bias right now amounts to a couple of percentage points, which is historically large. But these writings have triggered a very good question from many readers: why is unemployment defined this way? Shouldn’t it be designed to capture those who’ve left the labor force due to discouragement about their job seeking prospects? The obvious answer is yes, and, in fact, there’s another, more inclusive measure of labor market slack that kind of gets at that issue—it includes “discouraged” former job seekers. With its clever title of “U-6” this broader measure of labor utilization includes not only discourage job seekers but the partially employed as well, i.e., part-timers who would rather have full-time jobs. U-6, plotted below along with the official rate, was 13.1% last month, almost twice the 6.7% of the official rate. FTR, U-6 has fallen even faster than the official rate (4 ppts vs 3.7 ppts compared to their peaks), as both the numbers of involuntary part-timers and discouraged workers have diminished of late. But is this type of more inclusive measure really better? I’m not sure. The official measure has the advantaged of simplicity: you’re unemployed if you’re unsuccessfully seeking work. Boom. That’s it. Everything else involves some degree of psychology. You say you’re discouraged because there aren’t enough jobs, but how do you know if you’re not looking? Would the involuntary part-timers really kick up their hours if they could?
The Case for a Better U - Paul Krugman - Unemployment has fallen a lot recently, but for a peculiar reason: not so much rising employment as a falling share of the population actively looking for work. This has sparked a debate over how much of the decline in labor force participation reflects a weak job market — why bother looking? — and how much demography, changing culture, and all that. Luckily, Jan Hatzius of Goldman Sachs makes a very good point: the headline unemployment rate is only one of several measures (it’s actually U3), and given our uncertainty about what’s going on it makes sense to also look at broader measures, notably U6, which counts discouraged and marginally attached workers. Normally all of the Us move in tandem, but lately, not so much. Here’s my version: a scatterplot of U6 versus U3 since the U6 numbers became available in 1994, with data points up to June 2009 — the start of the official recovery — in blue, those after in red. The black line shows the average relationship before the current recovery. What you can see is that the two measures are telling different stories: U3 is considerably lower than you would have predicted using U6, and the labor market looks much worse using the broader measure. My take on this is that at the very least you should look at both measures; it’s obvious from the figure that doing so would lead you to conclude that the economy still has a lot of slack, something confirmed by low inflation. This economy needs more, not less, stimulus.
Inside the ADP Numbers: Evidence that Friday’s Job Report Was a Giant Outlier - The question about Friday’s shockingly weak December jobs report is not so much whether it was an anomaly but how much of an anomaly it was. If the real job creation number was closer to the 200,000 consensus forecast rather than the Bureau of Labor Statistics’ bombshell estimate of just 74,000 new jobs, the market response looks overblown. That is especially true in the currency markets, where speculation that the Federal Reserve may now have to slow down the tapering of its bond-buying program has sent the dollar lower. But if the anomaly — which many believe arose due to a mix of inclement weather and some questionnaire errors – accounted for, say, just 50,000 undercounted jobs, then the notion of a recovering labor market truly does need to be downgraded, and with it our expectations for future Fed policy. On that debate, Moody’s Analytics chief economist Mark Zandi, the economist that compiles an alternative closely watched monthly estimate of private-sector job growth from data provided by Automated Data Processing, offers some help. The evidence he draws from his work on that data suggests that we shouldn’t pay too much attention to the December numbers.Mr. Zandi says if you strip out a special adjustment he made to ADP’s raw data that’s designed to offset the distorting effect of the firm’s year-end “purge” of dormant payrolls accounts, the tally of net new hires in the month of December exceeded that of December 2012 by a hefty 125,000 jobs. That helps quash the argument that there was a upward adjustment error in ADP’s December estimate for jobs growth, which came in at a very strong 238,000 jobs and triggered a scramble among economists to increase their forecasts for the following Friday’s official report. If the raw ADP data had shown a far more modest improvement from its job growth tally in December 2012, it might have suggested that Mr. Zandi’s team had overcompensated for the purge-related decline in ADP payroll positions.
More Employment Graphs: Duration of Unemployment, Unemployment by Education, Construction Employment and Diffusion Indexes - A few more employment graphs by request ... This graph shows the duration of unemployment as a percent of the civilian labor force. The graph shows the number of unemployed in four categories: less than 5 week, 6 to 14 weeks, 15 to 26 weeks, and 27 weeks or more. The general trend is down for all categories, and both the "less than 5 weeks" and 6 to 14 weeks" are close to normal levels. The long term unemployed is at 2.5% of the labor force - the lowest since April 2009 - however the number (and percent) of long term unemployed remains a serious problem. This graph shows the unemployment rate by four levels of education (all groups are 25 years and older). Clearly education matters with regards to the unemployment rate - and it appears all four groups are generally trending down. Although education matters for the unemployment rate, it doesn't appear to matter as far as finding new employment. Note: This says nothing about the quality of jobs - as an example, a college graduate working at minimum wage would be considered "employed". This graph shows total construction employment as reported by the BLS (not just residential). Since construction employment bottomed in January 2011, construction payrolls have increased by 398 thousand. According to the BLS, construction employment declined in December (probably due to weather). Historically there is a lag between an increase in activity and more hiring - and it appears hiring should pickup significant in 2014. The BLS diffusion index for total private employment was at 58.8 in December, down from 63.2 in November. Think of this as a measure of how widespread job gains are across industries. The further from 50 (above or below), the more widespread the job losses or gains reported by the BLS. Job growth was still fairly widespread in December (a good sign even with fewer jobs added).
Bad Seasonal Adjustment Misleads Market, Confuses Traders (and Reporters) on Jobs - The headline number for non farm payrolls has grossly overstated the weakness in December jobs growth. The reported (fictional, seasonally adjusted) gain of 74,000 jobs in December compared with economists’ consensus expectation of a gain of 197,000. The headline number was even lower than even the lowest estimate in the Bloomberg survey.The miss of 123,000 grossly overstates the actual slowing in December. In whole number terms the actual, not seasonally adjusted (NSA) change in December was within 37,000 of the average monthly change for the past year. In the next month or two, the SA data will return to trend with a combination of larger increases in the latest month and likely upward revisions for December. For now, the market and the Fed will be misled by concentrating on the bad headline number. Actual, not seasonally adjusted data shows that the annual growth rate has averaged 1.645% over the prior 12 months, with very little deviation from the trend. December was only 0.15% slower than the growth rate in November, which was the best month since August 2012. The actual year to year gain of 1.618% was within 0.027% of the average year to year gain each month. As you can see from the chart, there really is nothing to see here. The downtick was well within the normal range, merely offsetting the uptick in the growth rate in November. This trend has been remarkably stable for the past two years. While some see that as data manipulation, I’m not that troubled by the regularity. It is consistent with other data I track. Massive, spectrum wide data manipulation by multiple agencies to achieve cross data consistency seems unlikely, if not impossible. It is really not that surprising to see a steady growth rate in such a large economy with a slow, plodding momentum of its own, regardless of how much tweaking the Fed and the government try. The US economy is a mammoth. It creates its own inertia. It does not change direction quickly. It only seems that way to most people because they’re not paying attention to the big picture trends.
Big Picture Employment Trend Remains Crappy - I have previously shown how the headline number for non farm payrolls overstated the weakness in December jobs growth. That was about how the pundits and the media are often misled by their slavish devotion to seasonally adjusted data. The point was about short term market misdirection. Sometimes the short term data reasonably reflects the trend, even though it is fictitious. But other times it doesn’t, and it’s impossible to know the difference if you don’t at least also look at the actual, not seasonally adjusted data, which I do. And I figure, if you know the direction of the actual data, why bother with the seasonally adjusted crap? The big picture employment trend remains a disaster for the American people. Below are a few charts to illustrate. I won’t bore you with all the numbers, just enough to tell the story along with the pictures. This data is from the BLS Household Survey, from which the unemployment rates are derived. The Non Farm Payrolls data is from the Establishment Survey. I believe that survey overstates the number of people actually employed because it counts each job, not each job holder. Some people hold two or more jobs. First let’s look at total employment and full time employment, and the percentage of Americans holding full time jobs. The percentage of Americans holding full time jobs has barely budged since the bottom of the recession and the rate of improvement has actually slowed since 2011. This is not a cyclical phenomenon. This ratio has been trending lower since 2000. While Wall Street and the fortunate 20% of the American people who own 92% of the stocks outstanding gorged on manna from the Fed in 2013, the growth rate in the number of full time employed people actually fell from around 2.5% annually to less than 1.5% annually. Not only has the Fed pumping up stock prices led to no trickle down, in fact, the opposite has occurred. Cheap money has encouraged speculation, stock buybacks, malinvestment, and overinvestment in technologies and capacity that eliminate jobs and reduce the value of human labor in the marketplace.
Structural Demographic Trends in Employment: Monthly Update - The Labor Force Participation Rate (LFPR) is a simple computation: You take the Civilian Labor Force (people age 16 and over employed or seeking employment) and divide it by the Civilian Noninstitutional Population (those 16 and over not in the military and or committed to an institution). The result is the participation rate expressed as a percent. The first chart below splits up the LFPR data since 1948 in two ways: by age and by gender. For the former, I chose the 25-64 age cohorts to represent what we traditionally think of as the "productive" (pre-retirement age) work force. The BLS has data for ages 16 and over, but across this 64-year time frame college attendance has surged dramatically. So I opted for age 25 as the lower boundary to reduce the college-years skew. Note the squiggly lines for the productive years and jumbled dots for the older cohorts. These result from my use of non-seasonally adjusted data. The BLS does have seasonally adjusted data for many cohorts, but not the older ones, so I used the non-adjusted numbers for consistency.The next chart eliminates the squiggles with a simple but effective seasonal adjustment suitable for long timeframes, a 12-month moving average. .The growth of women in the workplace, the solid red line, was a major trend. The financial advantage of two income households was boosted by Title VII of the Civil Rights Act of 1964, which prohibits discrimination by race, color, religion, sex, or national origin. The Age Discrimination in Employment Act of 1967 helped to stabilize the decline in the 65 and over participation rate, at least until the 11-month recession that started in December 1969. As for the age 25-64 cohorts, the participation rate for men peaked way back in May 1954 at 95.9%; for women it was fifty years later in October 2004 at 72.8%, and for the combined cohort is was in March 1998 at 80.2%.
Vital Signs: Were December Payrolls Really Up by 130,000? - “Wait for the revisions.” That is what many economists said after the Labor Department’s initial read on December payrolls showed a weak 74,000 net gain in jobs, far below the consensus forecast of 200,000. Recent history says economists are giving good advice. Since late 2010 (after hiring for the U.S. census skewed the payrolls numbers), the consensus forecasts have overshot the initial payroll change by a large margin (more than 80,000) on eight separate occasions. On average, the forecasters thought the payroll change would by 98,000 jobs higher than the Labor Department reported initially. When the final revisions came through, however, the average miss shrank to 56,000. In only one case, May 11, was the final number actually worse than the initial print, and that was only by 1,000 fewer jobs. If December’s revisions follow the average, the Labor Department eventually will say payrolls were up 130,000 slots last month. That’s still below the expectations of 200,000 but not as head-turning as last Friday’s disappointment. Moreover, one can hope that December’s payrolls data follow the pattern of August 2011. Back then, investors and economy-watchers were stunned when Labor said zero net jobs were added, well below the 80,000 gain expected. But once the final number came out, it turned out 104,000 new jobs were added, beating the consensus forecast.
Tracking Part-Time Work: Some Surprising Details and a Look Ahead - The share of part-time workers in the U.S. labor force rose to unusually high levels during the recession of 2007-2009 and has fallen only slowly during the subsequent recovery. As the following chart shows, the share of workers putting in less than 35 hours a week hit a low of 15.5 percent of the labor force in October 2007 and then rose sharply to a peak of 18.1 percent in May 2009. As of December 2013, the share of part time work was still over 17 percent, less than halfway back to the pre-recession low. Many observers find the trend toward part-time work alarming. In her blog for The New York Times, Catherine Rampell writes, One of the more unsettling trends in this recovery has been the rise of part-time work. We are nowhere near recovering the jobs lost in the recession, and the track record looks even worse when you consider that so many of the jobs lost were full time, whereas so many of those gained have been part time. How worried should we be? To understand what is going on, we need to dig beneath the summary statistics shown in the chart and look the details, some of which I find surprising. The numbers begin to look a little less alarming if we break down the total of part-timers into three categories used by the BLS:
- People who normally work part time for “noneconomic reasons” such as childcare, family or personal obligations, school or training, retirement or Social Security limits on earnings, and other reasons. These are often called voluntary part-time workers.
- Those who work part-time for “economic reasons,” popularly called involuntary part-time workers, a category that includes:
- People who are working part-time because of slack work or business conditions. By implication, many or most of these are people who took jobs that they expected to be full time, only to have their employers cut their hours. Presumably, they stay on the job either because short hours are better than none, or because they expect to return to full time status in the future. At least some of them presumably continue to receive full-time benefits during temporary periods of short hours.
- People who can only find part-time work. By implication, these include people who take jobs that they know will never be full time and would leave them if they found full-time work.
Population adjusted initial jobless claims and the unemployment rate: an update - Occasionally over the last few years I have remarked upon the usually tight relationship between population-adjusted initial jobless claims and the unemployment rate. Overall the unemployment rate tends to follow the trend in the population-adjusted initial jobless claims with about a 6 to 12 month lag: Thus, while we can quarrel about the reasons, the fact that the unemployment rate has continued to drop sharply over the last year, following the trend in initial claims, was not unexpected. With initial claims near historical lows as a share of population, the issue becomes whetherr the unemployment rate can fall much below 6%, or whether the gap that opened up in 2009 will ultimately be closed. I anticipate that the unemployment rate will continue to fall, perhaps at a somewhat slower rate, to about 6%, but have a very difficult time declining meaningfully below that level.
Weekly Initial Unemployment Claims decline to 326,000 -- The DOL reports: In the week ending January 11, the advance figure for seasonally adjusted initial claims was 326,000, a decrease of 2,000 from the previous week's revised figure of 328,000. The 4-week moving average was 335,000, a decrease of 13,500 from the previous week's revised average of 348,500. The previous week was revised down from 330,000. The following graph shows the 4-week moving average of weekly claims since January 2000. The dashed line on the graph is the current 4-week average. The four-week average of weekly unemployment claims increased to 335,000
Jobless Claims Fell Again Last Week - New filings for unemployment benefits inched lower last week, dropping for the second week in a row. The decline of 2,000 to a seasonally adjusted 326,000 for the week through January 11 is a welcome sign, of course. But the trend looks a bit sluggish lately, raising questions about the potential for stronger growth in the labor market in the months ahead. There’s still a fair amount of distance between the current level of new claims and the post-recession low of 294,000 in mid-September 2013. Filings may eventually fall under that low-water mark, but for the moment it seems like the downward momentum has slowed to a crawl. The good news is that claims continue are still retreating at a healthy rate on a year-over-year basis. New filings dropped 7% last week vs. the year-earlier level. But here too the momentum has decelerated: the annual rate of decline is roughly half as much as the previous week’s pace of descent. A warning sign? Or is it just another installment of noise that's affected and distorted this data set lately? To be determined.
Continuing Claims Surge Most In Over 5 Years To 6-Month Highs. Initial claims beat expectations very modestly (326k vs 328k expected) and hover at their average level of the last 6 months. Non-seasonally-adjusted saw initial claims surge to 438k. It would appear the trend of improving claims has ended for now. What is perhaps more worrying is the continuing claims surged by their most in over 5 years - at 3.03 million, this is the highest in 6 months (and the biggest miss in 6 months. It is worth noting that this is before the emergency benefits for 1.3 million Americans disappear (which will likely begin to show up next week or the week after). This is the worst weekly shift in continuing claims since November 2008...
BLS: 4.0 Million Job Openings in November - From the BLS: Job Openings and Labor Turnover Summary There were 4.0 million job openings on the last business day of November, little changed from October, the U.S. Bureau of Labor Statistics reported today. The hires rate (3.3 percent) and separations rate (3.1 percent) were unchanged in November. ... Quits are generally voluntary separations initiated by the employee. Therefore, the quits rate can serve as a measure of workers’ willingness or ability to leave jobs. Layoffs and discharges are involuntary separations initiated by the employer. ... The number of quits (not seasonally adjusted) increased over the 12 months ending in November for total nonfarm and total private and was little changed for government. The following graph shows job openings (yellow line), hires (dark blue), Layoff, Discharges and other (red column), and Quits (light blue column) from the JOLTS. This series started in December 2000. Note: The difference between JOLTS hires and separations is similar to the CES (payroll survey) net jobs headline numbers. This report is for November, the most recent employment report was for December. Notice that hires (dark blue) and total separations (red and light blue columns stacked) are pretty close each month. This is a measure of turnover. When the blue line is above the two stacked columns, the economy is adding net jobs - when it is below the columns, the economy is losing jobs. Jobs openings increased in November to 4.001 million from 3.931 million in October. The number of job openings (yellow) is up 5.6% year-over-year compared to November 2012 and this is the first time job openings have been above 4 million since 2008.. Quits decreased sharply in November and are down about 5% year-over-year. These are voluntary separations. (see light blue columns at bottom of graph for trend for "quits").
The New Normal Paradox: All The Job Gains With Half The Hiring? - Why is hiring important? Because that is the actual process by which those without a job end up with a job. And as we just learned today after the latest JOLTS release, which showed that there were over 4 million job openings (4,001 to be precisely) for the first time since 2008, a far more important number is the update on Hires which at 4.5 million barely changed from last month, but more importantly, is barely a fraction of where it should be based on the number of job gains reported by the BLS monthly. The chart below confirms this stunning discrepancy: a surge in jobs with barely half the pre-recession hiring?
Some 2.3 Million Kids Live With Long-Term Unemployed Parent - The number of children living with a parent who has been out of work for at least six months has tripled since the recession started in 2007. Throughout 2013, an average of 2.3 million children — or about 3.3% of all kids in the U.S. — lived with a parent who had been seeking work for at least half a year, according to new figures from the Urban Institute, a Washington think tank. That’s up from about 754,000 in 2007. Such families are heavily concentrated in states hit hard by the housing crash and financial crisis, or otherwise have longstanding poverty problems. Last year, children living with long-term unemployed parents made up 5.5% of all children in Rhode Island and nearly 5% in Georgia and Illinois. The District of Columbia led the nation at 7.4%. (See a map showing how many such children are in each state.) The recession began in December 2007 and ended in June 2009, though the historically weak recovery has kept long-term unemployment high. The Urban Institute pointed to studies that found unemployment among parents “can hurt children’s school performance, as observed in lower math scores, poorer school attendance, and higher risk of grade repetition.”
2.3 million children have a long-term jobless parent - More than 2.3 million children currently live with a long-term unemployed parent.That's three times more than in 2007, according to research by the Urban Institute, a nonpartisan think tank. The report comes as Congress considers whether to extend recession-era jobless benefits. Federal unemployment benefits ended on Dec. 28,cutting off 1.3 million workers, many of whom are parents. "Unemployment checks can help families cover their rent or mortgage payments, pay for utilities and transportation, and keep food on the table," said Julia Isaacs and Olivia Healy who co-authored the analysis. Poverty has tripled among parents who have not had a job for six months or more -- from 12 percent to 35 percent. Lately, the social impact of long-term unemployment is also gaining attention, especially after the monthly jobs report last week showed that many are losing heart and dropping out of the workforce. It affects children in other ways: their parent's job losses can lead to worse test scores and school performance. The risk a child will repeat a grade also goes up by 15%, according to a 2009 study by the National Bureau of Economic Research.
For the long-term unemployed, the US job market is in a depression - In new a report looking at the US labor market and inflation, JP Morgan unintentionally makes a pretty good case for special help for America’s long-term unemployed: One of the hallmarks of the Great Recession and Not-So-Great Recovery is the unprecedented increase in the number of long-term unemployed (here, as in general practice, we define long-term unemployed as those unemployed 27 weeks of more, and short-term unemployed as those unemployed less than 27 weeks). In December, 3.9 million individuals were long-term unemployed, or 2.5% of the labor force. This is a new recovery low, reached after about four years of labor market expansion. For comparison, in what was previously the worst post-war recession in 1981-2, the long -term unemployment rate maxed out at 2.5%, and within a year was back down to around 1%. One of the many challenges facing the long-term unemployed is that they may appear stigmatized in the eyes of potential employers. Unlike most market transactions, the labor market has certain hidden information problems; for example, employers are not able to perfectly assess the motivation or work ethic of potential jobseekers. Because of this, employers may rely on some readily identifiable characteristics of applicants. Thus, employers may shy away from hiring the long-term unemployed, as they could infer (perhaps incorrectly) that the lack of a recent job history is a negative indicator of the worker’s motivation. This seems to be one of the reasons why wages upon re-employment tend to decline the longer a person is unemployed.
Update: When will payroll employment exceed the pre-recession peak? --Just over two years ago I posted a graph with projections of when payroll employment would return to pre-recession levels (see: Sluggish Growth and Payroll Employment from November 2011). In 2011, I argued we'd continue to see sluggish growth. On the graph I posted two lines - one with payroll growth of 125,000 payroll jobs added per month (the pace in 2011), and another line with 200,000 payroll jobs per month. The following graph is an update with reported payroll growth through December 2013. The dashed red line is 125,000 payroll jobs added per month. The dashed blue line is 200,000 payroll jobs per month. Both projections are from November 2011. So far the economy has tracked just below the blue line (200,000 payroll jobs per month). Right now it appears payrolls will exceed the pre-recession peak in mid-2014. Currently there are about 1.18 million fewer payroll jobs than before the recession started, and at the expected pace of job growth in 2014 it will take about 6 months to reach the previous peak.
High Definition: The ‘Gamification’ of the Office Approaches -- Imagine if at the office you were made to feel like you were playing "Candy Crush Saga." Envision that every one of your professional endeavors was meticulously tracked and measured in points, that there were levels to complete and you were given prizes for excellence. That every workplace action provided a tangible sensation of winning or losing as part of a system engineered to keep you addicted, thrilled to come back every morning. If your job worked like that, would you become a better employee? Or would you feel just the opposite—crushed by metrics, constantly watched over, infantilized by your boss's attempt to turn you into an automaton? I'm asking you as if your opinion here matters. In fact, it does not. All evidence suggests that your work one day will operate like a videogame to be conquered, rather than a craft to be perfected. The high-level name for this trend is "gamification," an ugly neologism that has seen terrific hype and terrific backlash in Silicon Valley over the past few years. The term refers to transferring the features that motivate players in videogames—achievement levels, say, or a constantly running score—into nongame settings. Gamification systems are possible because much of what we do in the workplace is conducted through software that can track our productivity, constantly measure our value and apply incentives that prod us to do better
If I Had a Hammer - Something very, very big happened over the last decade. It is being felt in every job, factory and school. My own shorthand is that the world went from “connected to hyperconnected” and, as a result, average is over, because employers now have so much easier, cheaper access to above-average software, automation and cheap genius from abroad. Brynjolfsson and McAfee, both at M.I.T., offer a more detailed explanation: We are at the start of the Second Machine Age. The First Machine Age, they argue, was the Industrial Revolution that was born along with the steam engine in the late 1700s. This period was “all about power systems to augment human muscle,” In the Second Machine Age, though, argues Brynjolfsson, “we are beginning to automate a lot more cognitive tasks, a lot more of the control systems that determine what to use that power for. In many cases today artificially intelligent machines can make better decisions than humans.” So humans and software-driven machines may increasingly be substitutes, not complements. What’s making this possible, the authors argue, are three huge technological advances that just reached their tipping points, advances they describe as “exponential, digital and combinatorial.” . Unlike the steam engine, which was physical and doubled in performance every 70 years, computers “get better, faster than anything else, ever,” says Brynjolfsson. Now that we’re in the second half of the digital chessboard, you see cars that drive themselves in traffic, Jeopardy-champion supercomputers, flexible factory robots and pocket smartphones that are the equivalent of a supercomputer of just a generation ago.
Free trade and the loss of U.S. jobs -- By now, even the most ossified right-wing economists concede that globalization has played a major role in the loss of American manufacturing jobs and, more broadly, the stagnation of U.S. wages and incomes. Former Federal Reserve vice chairman Alan Blinder has calculated that 22 percent to 29 percent of all U.S. jobs could potentially be offshored. That’s a lot of jobs: 25 percent would translate to 36 million workers whose wages are in competition with those in largely lower-income nations. Of the 11 nations with which the United States is negotiating the TPP, nine have wage levels significantly lower than ours.Trade agreements that promote the relocation of U.S. corporations’ factories to nations like China and Mexico have played a central role in the evisceration of American manufacturing and the decline in U.S. workers’ incomes. Two out of three displaced manufacturing workers who got new jobs between 2009 and 2012, the Bureau of Labor Statistics reports, experienced wage reductions — most of them greater than 20 percent. But perhaps the most devastating argument against the kind of trade accords the United States has entered into over the past quarter-century has been that inadvertently made by those defenders of such agreements who have used the 20th anniversary of the North American Free Trade Agreement — it went into effect on Jan. 1, 1994 — to celebrate its achievements. I’ve read many commemorative editorials, columns and speeches in praise of NAFTA, and not one of them has so much as mentioned the agreement’s effect on U.S. employment, wages or trade balance.
On Elizabeth Warren’s Bill Against Using Credit Scores in Employment Screening – Yves Smith - Since I give Elizabeth Warren a hard time when she pulls her punches, I am remiss in not giving a thumb’s up to her proposed Equal Employment for All Act, which would bar the use of credit reports in most hiring decisions. In the stone ages of my youth, it was unheard of to pull a credit report for a prospective worker. The only cases where it was considered relevant was for jobs in which the employee handled cash, such as a branch teller, since someone who was seriously in debt might find it hard to resist the temptation to pilfer. Of course, it goes without saying that making creditworthiness a condition for getting a job, which in many people’s cases is a condition for survival, entrenches the power of banks and other creditors. You don’t need debtors’ prisons if the consequence of a bad credit score could ultimately be living on the streets. The use of these records is essentially a misleading bit of busywork on the part of human resources departments. A post by Bob Lawless at Credit Slips points out that credit scores are generally useless in an employment context and merely pander to employers’ prejudices as to what constitutes virtue: there is money to be made in convincing those who make hiring decisions that there are data and services that can unlock the hidden traits of job applicants.
Dazed and Confused: Matt Yglesias on the Job Guarantee -- Matt Yglesias has written a post that has the words ‘Job Guarantee’ (JG) in the title but has nothing to do with the actual JG proposal. He begins by asking readers to imagine that:“…instead of handing out welfare checks and food stamps to these bums, we should make everyone who wants public assistance show up daily at a rally-point to be contracted out to do street-cleaning work. Think parolees sentenced to community service…”Unfortunately for him, that’s not the Job Guarantee and we have debunked such silly caricatures many times (e.g., here, here and here). Unfortunately for his readers, he is either unfamiliar with the most basic literature on the JG, or is deliberately misleading them. Let’s give him the benefit of the doubt and assume it’s the former.Yglesias proceeds to tell us that solving the unemployment problem for these “bums” this way is undesirable, because that would empower the Fed too much to focus on avoiding stock market crashes! With unemployment, however, the Fed will just have to keep pushing hard on that string, and sooner or later unemployment would magically disappear. You don’t even need to read Keynes to know that such a thing does not happen. Just read Bernanke (also here). The Fed cannot do it. We need fiscal policy. Even stranger is his implication that the Fed should not primarily focus its attention on regulations and financial instability!But back to the Job Guarantee. Lest there is any doubt about our claims, let me reiterate some of them here:
The Anti-Scientific Revolution in Macroeconomics - Paul Krugman - What brings this to mind is the debate over extended unemployment benefits, which I think provides a teachable moment. There’s a sort of standard view on this issue, based on more or less Keynesian models. According to this view, enhanced UI actually creates jobs when the economy is depressed. Why? Because the economy suffers from an inadequate overall level of demand, and unemployment benefits put money in the hands of people likely to spend it, increasing demand. But if you follow right-wing talk — by which I mean not Rush Limbaugh but the Wall Street Journal and famous economists like Robert Barro — you see the notion that aid to the unemployed can create jobs dismissed as self-evidently absurd. You think that you can reduce unemployment by paying people not to work? Hahahaha!Quite aside from the fact that this ridicule is dead wrong, and has had a malign effect on policy, think about what it represents: it amounts to casually trashing one of the most important discoveries economists have ever made, one of my profession’s main claims to be useful to humanity. If you read Barro’s piece, what you see is a blithe dismissal of the whole notion that economies can ever suffer from am inadequate level of “aggregate demand” — the scare quotes are his, not mine, meant to suggest that this is a silly, bizarre notion, in conflict with “regular economics.”
Unemployment Rate Set To Plunge As Bill To Restore Jobless Benefits Fails To Pass Senate - Following last week's surprising passage of the preliminary approval to extend emergency unemployment claims, i.e. emergency jobless claims, for 3 months, when six republicans sided with democrats and gave approval to the original $6.4 billion legislation, there was an expectation that up to 1.4 million Americans would get their benefits extended once again (despite the so-called recovery in the economy, and the job market, instead of just all time high S&P500). Moments ago such hopes were dashed, when a Senate plan to restore long-term jobless benefits hit a wall Tuesday after Republicans withdrew their support amid complaints over cost and other issues. The $18 billion bill, which would restore the benefits through the end of 2014, failed to clear a key test vote. Senate Majority Leader Harry Reid needed to attract 60 senators to move the bill forward, but the bill stalled on a 52-48 vote. No Republicans voted in favor. What happened between then and now, and why did those republicans revert back to the party line? Reid lost their support when he amended the bill and failed to come up with a plan to offset the cost within 10 years. "It doesn't look good," Maine GOP Sen. Susan Collins said before the vote and after a meeting with Reid. Collins and Nevada GOP Sen. Dean Heller unsuccessfully proposed that Reid go back to the three-month extension. "We're back to ground zero," Heller said.
The Wrong Guidepost on Unemployment - If the extension of long-term unemployment benefits is defeated in the Senate, it will represent an epic though predictable failure with many parents, not least the voting practices of the Senate, where majority rule is the exception. But the chart below shows another parent: the fact that the unemployment rate is significantly biased downward because of the decline in the labor force.Senator Charles Grassley, an Iowa Republican who voted against the extension on Tuesday (he was a “nay” on the cloture vote), was discussing the vote on the radio Wednesday morning. One rationale he stressed for his opposition was that the unemployment rate, at 6.7 percent, had fallen far and fast, signaling enough opportunities such that job seekers no longer needed extended jobless benefits.But as I’ve previously argued — and this is widely agreed upon by economists of all stripes — continuing labor market weakness has led millions of potential workers to leave the labor force and thus not be counted in the unemployment rate. (You’re counted only if you’re looking for work.) There’s some disagreement about how much of the labor force decline is due to weak demand — rather than reflecting dropouts who probably would have left anyway, like retiring boomers — but I don’t know anyone who thinks 6.7 percent is representative of the amount of slack on the current job market. Based on numbers I’ve written about in greater detail, I think a more representative rate would be about 9 percent. Heidi Shierholz of the Economic Policy Institute points out that if all the missing workers by her count were looking for work — clearly an upper bound — the rate would be above 10 percent. Others argue that smaller shares of those leaving the labor force would come back if labor demand strengthened, but even these analysts agree with the general point that 6.7 percent is not representative of actual slack.
Extension of unemployment benefits dead in Senate for now - Negotiations to extend emergency unemployment benefits to out-of-work Americans have fallen victim to a larger Senate debate over the rights of the minority party, making it more and more likely that the Senate will leave town this week without restoring benefits to the 1.3 million people that lost them when they expired on Dec. 28. Senate Majority Leader Harry Reid, D-Nev., has struggled to attract Republican votes as the GOP – still fuming about a rules change he pushed that diminishes their filibuster power – moved the goalposts on what it would take for GOP lawmakers to support an extension of the program. Two procedural votes on different variations on an extension failed Tuesday afternoon, sending lawmakers back the drawing table. At first, Senate Republicans coalesced around the demand that they would not support continuing the Emergency Unemployment Compensation (EUC) program if it were not paid for. Then, as Reid rounded up both Democratic and Republican proposals that would pay for an extension for varying lengths of time, Republicans began complaining that they were not allowed to offer amendments to the legislation.Reid offered five amendments for each side on Tuesday, as long as the threshold for including an amendment was 60 votes and final passage of legislation a simple majority of 51 – virtually guaranteeing that no Republican amendments would pass. Senate Minority Leader Mitch McConnell, R-Ky., rejected the offer right away, telling reporters that it “strikes me as fundamentally unfair.”
Filibuster Denies Unemployment Benefits to 4.9 million Long-Term Jobless Workers (Not Just 1.9 Million) in 2014 - Almost every story about the Republican filibuster of bills to revive the Emergency Unemployment Compensation (EUC) program mentions the 1.3 million people who had their benefits cut off on December 28, 2013. But they miss the bigger story: it’s not just those who were receiving checks when the program expired, but also many of the millions of people who are looking for work unsuccessfully right now but haven’t reached 26 weeks yet. And millions more will lose jobs in the next few months and exhaust their 26 weeks of unemployment benefits later in the year. When they do reach 26 weeks, and there are an estimated 70,000 new long-term jobless workers every week, they would receive EUC if the program were renewed. But because of the filibuster, they will get nothing—nothing but the back of the hand from Republicans in Congress who think these millions of people aren’t desperate enough to look hard for work at a time when there are roughly three unemployed for every job opening. When next presented with the opportunity, which could be as early as today, it is crucial that Republicans do the right thing and vote to renew Emergency Unemployment Compensation without delay.
Analysis: Wal-Mart case seen a key test in struggle over labor rights - Reuters- A challenge by the U.S. National Labor Relations Board (NLRB) to Wal-Mart Stores Inc's treatment of striking workers is likely to become a critical symbol of labor unions' attempts to organize the many non-union workplaces in the United States in the face of stiff resistance from management. The wider implications of the showdown for Wal-Mart and other American employers that don't recognize unions are likely to be much more important than any costs the giant retailer may face if it loses the case, labor experts said. The NLRB, which oversees union elections and polices unfair labor practices, issued a complaint on Wednesday accusing Wal-Mart of violating labor law by firing or disciplining workers for strikes over wages last year in 14 states. The NLRB's complaint breaks new ground for the agency, which is bringing more cases involving non-union workers as it asserts its role in an increasingly non-union economy. Wal-Mart is the largest employer to face such a complaint in years. "This is part of a drive by the NLRB to further police employees' labor rights in the non-unionized workforce," "If the NLRB can go after Wal-Mart and be successful, that sends a shot across the bow to all employers across the line - to employers that are similar in size, to smaller employers - that they are under the jurisdiction of the NLRB," he said.
Advocates for Workers Raise the Ire of Business - As America’s labor unions have lost members and clout, new types of worker advocacy groups have sprouted nationwide, and they have started to get on businesses’ nerves — protesting low wages at Capital Grille restaurants, for instance, and demonstrating outside Austin City Hall in Texas against giving Apple tax breaks. After ignoring these groups for years, business groups and powerful lobbyists, heavily backed by the restaurant industry, are mounting an aggressive campaign against them, maintaining that they are fronts for organized labor. Business officials say these groups often demonize companies unfairly and inaccurately, while the groups question why corporations have attacked such fledgling organizations. The United States Chamber of Commerce issued a detailed report in November criticizing what it calls “progressive activist foundations” that donate millions of dollars to these groups, which are often called worker centers. The business-backed Worker Center Watch has asked Florida’s attorney general to investigate the finances of the Coalition of Immokalee Workers. That group sponsored a protest last March in which more than 100 workers marched 200 miles to the headquarters of Publix supermarkets to urge it to pay more for tomatoes so farmworkers could be paid more.
Three posts on basic income - At Pieria, my study of the Speenhamland system of poor relief, which was actually an experiment in basic income. It was vilified for depressing wages, creating labour shortages, encouraging unsustainable population growth and requiring ever-higher taxes to support it. But as I show in the post, none of these is true. It actually worked well, and the things it was blamed for were largely caused by other factors. But when it was abolished, it was replaced with the cruellest form of welfare ever devised - and it looks ominously as though we may be heading down that same path again. At Forbes, my discussion of why we need a minimum wage. If we are going to have in-work and out-of-work benefits, and governments are going to try to compel people to work, then a minimum wage is essential to protect taxpayers from rising benefit bills as employers bid down wages. But a basic income that didn't compel people to work would be much better. At Coppola Comment, my technical discussion of uncertainty and safety in labour markets. The labour market is bifurcated into high-skill workers with safe jobs, and lower-skill (or rather, less marketable) workers with insecure jobs. But high-skill workers don't want or need safe jobs - it is their employers that need them to stay. It is lower-skill workers that need safe jobs, but their employers want to be able to replace them whenever they want. How do we resolve the asymmetric needs of workers and employers? If the relationship of this post to basic income isn't obvious, read the comments. Cig gets it. More on the pricing of the "safety asset" to follow. After all, that's what basic income is.
Could We Afford a Universal Basic Income? -- The first post in this series looked at the economic case for a universal basic income (UBI), by which I mean an unconditional grant, paid to every individual, that would be sufficient to maintain a decent minimum standard of living. In that post, I argued that replacing the many overlapping income support policies currently used in the United States with a UBI would be more effective in raising the incomes of poor and near-poor households while strengthening work incentives and improving administrative efficiency. The evident economic downside is that a UBI would be less narrowly targeted on the poor than existing programs. Because it would not, by its nature, be means tested, it would channel billions of dollars in grants to middle- and upper-income households. Some think that would make a UBI unaffordable without ruinous tax increases, deficits, or cuts to other government programs. This post looks at some of the fiscal realities of a UBI and concludes that such a program might not be fiscally unrealistic after all.
Economists Weigh in on Minimum Wage, Extending Unemployment, the Fed and More - As economic growth looks to pick up in 2014, a majority of economists in The Wall Street Journal’s latest forecasting survey say the U.S. shouldn’t extend unemployment benefits or raise the minimum wage. On average, real gross domestic product is forecast to grow 2.8% this year, after an estimated 2.6% gain in 2013, with the expansion accelerating over the course of the year. The GDP forecasts are only slightly above the quarterly patterns projected when the survey was last done in each of the past four months. But nearly three-quarters of forecasters think that if the economy surprises this year, it will be by growing faster than they forecast rather than disappoint as it has in previous years. Meanwhile, forecasters put better odds—43%—on breakout growth over the next 12 months than on recession, which they give just an 11% chance of happening.Labor markets also will look better, say forecasters. Hiring is projected to average more than 200,000 jobs a month, the first year since 2005 that the pace is above 200,000. Economists think the unemployment rate will fall to 6.6% by June 2014 and 6.3% by December 2014. As recently as August, economists expected the rate to fall only to 6.7% by end-2014. The expected accelerated downtrend reflects the speed with which the jobless rate declined in 2013, from 7.9% in January 2013 to 6.7% by December. The decline should allow the Fed to keep tapering its bond buying program. Almost all economists—87%—think the Fed will be out of the bond market by the end of 2014. Below are their answers to questions on the minimum wage, unemployment extensions, the future of the Fed and more:
Seven Nobel Laureates Endorse Higher U.S. Minimum Wage - Seven recipients of the Nobel Prize in Economic Sciences were among 75 economists endorsing an increase in the minimum wage for U.S. workers. In a letter released today, the group called for the hourly minimum wage to reach $10.10 by 2016 from its current $7.25, and then be indexed for inflation thereafter. They said “the weight” of economic research shows higher pay doesn’t lead to fewer jobs. Past increases in hourly pay have had “little or no negative effect on the employment of minimum wage workers, even during times of weakness in the labor market,” the economists wrote. “A minimum wage increase could have a small stimulative effect on the economy as low-wage workers spend their additional earnings.” Nobel Prize winners Kenneth Arrow, Peter Diamond, Eric Maskin, Thomas Schelling, Robert Solow, Michael Spence and Joseph Stiglitz were among signatories of the letter, which was released by the Economic Policy Institute, a Washington research group funded in part by labor unions.
Economist Statement on the Federal Minimum Wage - Dear Mr. President, Speaker Boehner, Majority Leader Reid, Congressman Cantor, Senator McConnell, and Congresswoman Pelosi: July will mark five years since the federal minimum wage was last raised. We urge you to act now and enact a three-step raise of 95 cents a year for three years—which would mean a minimum wage of $10.10 by 2016—and then index it to protect against inflation. Senator Tom Harkin and Representative George Miller have introduced legislation to accomplish this. The increase to $10.10 would mean that minimum-wage workers who work full time, full year would see a raise from their current salary of roughly $15,000 to roughly $21,000. These proposals also usefully raise the tipped minimum wage to 70% of the regular minimum. This policy would directly provide higher wages for close to 17 million workers by 2016. Furthermore, another 11 million workers whose wages are just above the new minimum would likely see a wage increase through “spillover” effects, as employers adjust their internal wage ladders. The vast majority of employees who would benefit are adults in working families, disproportionately women, who work at least 20 hours a week and depend on these earnings to make ends meet. At a time when persistent high unemployment is putting enormous downward pressure on wages, such a minimum-wage increase would provide a much-needed boost to the earnings of low-wage workers. Research suggests that a minimum-wage increase could have a small stimulative effect on the economy as low-wage workers spend their additional earnings, raising demand and job growth, and providing some help on the jobs front. (PhD signatories)
Time to end redistribution upwards: minimum wage increases would boost economy and lift all boats.-- Linda Beale - No matter how much the business lobby complains about the “business costs” of increasing the minimum wage, legislators should look past that self-serving ideology and look at reality. Workers have contributed to increased productivity but received a stagnant to declining share of the income that comes from the increased productivity. IN the meantime, top-echelon managers and shareholders reap larger and larger benefits from the increased productivity provided by the workers. At the same time, much of the tax expenditure provisions in the Internal Revenue Code–from the charitable contribution deduction (and things like contributing appreciated assets from IRAs) to the mortgage interest deduction to the life insurance exclusion to the preferential rate on capital gains and the almost non-taxation of corporate dividends are hugely beneficial to the same top echelon in the income distribution, meaning that those provisions are aiding “redistribution”–just not the kind that is condemned by those on the right as a kind of socialism, since this redistribution is upwards and favors the rich.
Obama weighing executive action on minimum wage? -- At his meeting with Democratic Senators last night, President Obama indicated that he is giving serious consideration to executive action designed to raise the minimum wage for employees of federal contractors, according to one Senator who was present.Proponents want to see this executive action happen on the merits — they believe it could impact as many as two million employees of federal contractors, and would help the economy. But they also believe such action could give a boost of momentum to the push for a minimum wage hike for all American workers, which obviously would require Congressional approval, but is currently facing Republican opposition.Senator Bernie Sanders told me in an interview that the president took the idea very seriously when asked about it last night. “I am very pleased that the president and members of his administration indicated they’re giving very serious consideration to this proposal,” Sanders said. “The president is weighing the pros and cons in terms of the impact on the overall debate.”
Enemies of the Poor, by Paul Krugman -- Suddenly it’s O.K., even mandatory, for politicians with national ambitions to talk about helping the poor. This is easy for Democrats, who can go back to being the party of F.D.R. and L.B.J. It’s much more difficult for Republicans, who are having a hard time shaking their reputation for reverse Robin-Hoodism, for being the party that takes from the poor and gives to the rich. And the reason that reputation is so hard to shake is that it’s justified. It’s not much of an exaggeration to say that right now Republicans are doing all they can to hurt the poor, and they would have inflicted vast additional harm if they had won the 2012 election. Moreover, G.O.P. harshness toward the less fortunate isn’t just a matter of spite...; it’s deeply rooted in the party’s ideology...The most important current policy development in America is the rollout of the Affordable Care Act, a k a Obamacare. Most Republican-controlled states are, however, refusing to implement a key part of the act, the expansion of Medicaid, thereby denying health coverage to almost five million low-income Americans. And the amazing thing is that ... the aid through would cost almost nothing; nearly all the costs ... would be paid by Washington.Meanwhile, those Republican-controlled states are slashing unemployment benefits, education financing and more. As I said, it’s not much of an exaggeration to say that the G.O.P. is hurting the poor as much as it can.
The Vicious Circle of Income Inequality - Inequality in the United States has been increasing sharply for more than four decades and shows no signs of retreat. In varying degrees, it’s been the same pattern in other countries. The economy has been changing, and new forces are causing inequality to feed on itself.One is that the higher incomes of top earners have been shifting consumer demand in favor of goods whose value stems from the talents of other top earners. Because the wealthy have just about every possession anyone might need, they tend to spend their extra income in pursuit of something special. And, often, what makes goods special today is that they’re produced by people or organizations whose talents can’t be duplicated easily. Wealthy people don’t choose just any architects, artists, lawyers, plastic surgeons, heart specialists or cosmetic dentists. They seek out the best, and the most expensive, practitioners in each category. The information revolution has greatly increased their ability to find those practitioners and transact with them. So as the rich get richer, the talented people they patronize get richer, too. Their spending, in turn, increases the incomes of other elite practitioners, and so on. More recently, rising inequality has had much impact on the political process. Greater income and wealth in the hands of top earners gives them greater access to legislators. And it confers more ability to influence public opinion through contributions to research organizations and political action committees. The results have included long-term reductions in income and estate taxes, as well as relaxed business regulation. Those changes, in turn, have caused further concentrations of income and wealth at the top, creating even more political influence.
Inequality as a Problem of Constitutional Law - Ultimately, our Constitution appears like a great innovation that was never updated to confront industrial, global corporations - a power every bit as destructive as the unfettered power of the state. Our Constitution is a pre-industrial document. It did not confront and therefore, does not restrain the power of corporations. Senator Franken has suggested a constitutional amendment to the effect that "corporations are not people." This is certainly a critical element, but in my view, not even close to enough. Effectively restraining the negative effects of markets, requires the kind of procedural “shock and awe” our Framers employed against the state. This requires not only restraining the negative effects of markets (all of them that can be identified), but of strengthening the rights and institutions of the people. With respect to our economic system, I believe what is required is to make it a political economy and not merely a stand-alone economic system. Currently, our economic theory operates without any stated goal other than GDP growth. We know that it is actually operating very efficiently to enrich the very wealthy, but even those who seek to reform it are consistently unable to connect economic arguments to a coherent political theory. At times John Rawls is called into service and at times Utilitarianism, but most often, no reason is given at all. I actually believe Keynes understood intuitively the political theory I’m advocating, but he never developed it as a political theory. My argument is that the political theory understood by Keynes is enshrined in our Constitution, but its purpose has been wholly undermined.
How Occupy Wall Street Won In One Chart - Agree or disagree with the aims and means of Occupy Wall Street, but the movement changed the way we think about our world forever.For proof, look no further than the upcoming World Economic Forum in Davos. Each year, the organization puts out a report indicating what it believes are the world's biggest risks.For the past three years, income inequality has been the #1 global risk.But prior to 2012, inequality wasn't even on the list. Those protests in 2011 clearly had a profound on global thinking, right up to the elite level. Check out the chart below, listing the top "global risks" discussed at Davos since 2007, and you'll see what we mean:
How Government Wages War on the Poor - If it seems strange to claim that the federal government has become more anti-poor than anti-poverty, consider these recent or current policies. (The list is not exhaustive.) Emergency unemployment compensation ended for 1.3 million jobless Americans just after Christmas. Unless it is restored, as Democrats are now struggling to do, another 3.6 million will lose their benefits this year. Scaling back unemployment compensation is a highly efficient way to create more poor people. Never has the government terminated such benefits while jobs were so scarce.Last month's acclaimed bipartisan budget deal included cuts in food stamps, though not nearly as much as Republicans sought. The two parties are now girding for battle over raising the federal minimum wage; it would be the first such increase in almost five years. The Democrats want to boost the minimum hourly wage from the current $7.25 to $10.10 in three annual increments. Even though the evidence suggests that modest increases in the minimum wage raise the incomes of poor and near-poor workers without causing much job loss, the opposition is substantial. Many Republican governors are declining the Medicaid component of ObamaCare—an option given them by the Supreme Court's split-the-baby decision on health mandates. These refusals deprive poor and near-poor families of a sorely needed benefit that would cost the states next to nothing. And, of course, the unremitting war against unions continues in state capitols across the country, though this is more germane to the general issue of inequality than to poverty.
It's Expensive To Be Poor - When I worked on my book, Nickel and Dimed: On (Not) Getting By in America, I took jobs as a waitress, nursing-home aide, hotel housekeeper, Wal-Mart associate, and a maid with a house-cleaning service. I did not choose these jobs because they were low-paying. I chose them because these are the entry-level jobs most readily available to women. What I discovered is that in many ways, these jobs are a trap: They pay so little that you cannot accumulate even a couple of hundred dollars to help you make the transition to a better-paying job. They often give you no control over your work schedule, making it impossible to arrange for child care or take a second job. And in many of these jobs, even young women soon begin to experience the physical deterioration—especially knee and back problems—that can bring a painful end to their work life. I was also dismayed to find that in some ways, it is actually more expensive to be poor than not poor. If you can’t afford the first month’s rent and security deposit you need in order to rent an apartment, you may get stuck in an overpriced residential motel. If you don’t have a kitchen or even a refrigerator and microwave, you will find yourself falling back on convenience store food, which—in addition to its nutritional deficits—is also alarmingly overpriced. If you need a loan, as most poor people eventually do, you will end up paying an interest rate many times more than what a more affluent borrower would be charged. To be poor—especially with children to support and care for—is a perpetual high-wire act.
Poverty and Inequality, in Charts -- Many War on Poverty analyses, including my own, invoked increased inequality as a factor keeping poverty rates higher today than would otherwise be the case. Many commenters, however, seemed suspicious of this link between poverty and inequality, and as I look back at much at what’s been written, my own piece included, I see it was left largely unexplained. So let me remedy that omission. This chart below by the poverty scholar Sheldon Danziger has a few moving parts to it, but I think it helps get at the underlying relationship between poverty and inequality. Professor Danziger does something very simple here: he predicts poverty rates based solely on real growth in gross domestic product (per-person G.D.P., to be precise). And he finds that overall economic growth was pretty much all you needed to predict the poverty rate from the late 1950s to the mid-’60s. After that, however, if you based your poverty prediction on G.D.P. growth, you would have concluded that poverty ended at some point in the mid-1980s, which … um … didn’t happen. Of course, G.D.P. growth slowed down some in the 1970s, and some analysts back then blamed the slowdown for this uncoupling from poverty trends. But Professor Danziger shows that’s not the problem, as the line with the circles in it simulates the poverty/G.D.P. relationship, holding G.D.P. growth constant at its pre-slowdown rate. That simply shows poverty ending a few years before the other prediction based on actual G.D.P. growth. So no, it wasn’t just slowing G.D.P. growth that led to the disconnect. It was also — among many other factors, of course — growing inequality.
If You Really Care About Ending Poverty, Stop Talking About Inequality - Economic inequality is the “defining challenge of our time,” President Barack Obama declared in a speech last month to the Center for American Progress. Inequality is dangerous, he argued, not merely because it’s unseemly to have a large gap between the rich and the poor, but because inequality, itself, destroys upward mobility, making it harder for the poor to escape from poverty. “Increased inequality and decreasing mobility pose a fundamental threat to the American Dream,” he said.Obama is only the most prominent public figure to declare inequality Public Enemy #1 and the greatest threat to reducing poverty in America. CAP’s new Washington Center for Equitable Growth, Princeton economist Alan Krueger, and economist Miles Corak (with his famous Great Gatsby Curve) have all argued that it’s harder for the poor to climb the economic ladder today because the rungs in that ladder have grown farther apart. In Krueger’s words, countries like the United States with high inequality tend to have less upward mobility “for children from low-income families.” But for all the new attention devoted to the 1 percent, a new dataset from the Equality of Opportunity Project at Harvard and Berkeley suggests that, if we care about upward mobility overall, we’re vastly exaggerating the dangers of the rich-poor gap. Inequality itself is not a particularly potent predictor of economic mobility, as sociologist Scott Winship noted in a recent article with his colleague Donald Schneider based on their analysis of this data.
How to Reduce Poverty & Inequality at No Cost - The minimum wage hasn't kept pace with inflation or with average wages in the economy as a whole. The result: a single parent who works full-time at a minimum wage job earns less than $15,000 a year, hardly enough to support her family, especially after deducting payroll taxes and work-related expenses such as child care. By raising the minimum wage to, say, $10.10 she will be a lot better off, earning a little over $20,000. a year. While a higher minimum wage will help to boost earnings, critics worry about its effects on hiring, arguing that employers will create fewer jobs if they have to pay higher wages. Although past increases do not appear to have adversely affectedemployment, there is no denying the risk that much larger increases might pose to the job prospects of the least skilled.Raising the minimum from its current $7.25 to $15.00 per hour, as some have advocated, would more than double the cost to an employer and likely have some impact on hiring. Second, a higher minimum isn't well targeted on just the poor. Many of the people who would benefit from a higher minimum are secondary workers from more advantaged families. Less than one-fifth are poor. For these reasons a better option is to combine some increase in the minimum with an expanded EITC. The EITC is well-targeted on those who most need assistance. Moreover, because it is paid to the employee as a refundable tax credit, it does not place any new burdens on employers.
How will conservatives save the poor? - Kevin Williamson, one of my favorite conservative writers, goes to rural Kentucky, observes white poverty, and is saddened by what he sees. The key word here is "white". For most of the past few decades, conservatives basically told us that poverty was a black problem (and maybe a Hispanic problem), and that therefore white people basically didn't need to worry about it, and should certainly resist any liberal attempts to have the government do anything about it. During that whole time, liberals were shouting that poverty was a white problem too, but of course conservatives did not listen. Now, conservatives are finally discovering that yes, poverty is a white thing too. Why are conservatives now discovering this? Maybe it's thanks to the work of people like Charles Murray, who have pointed out the cultural pathologies associated with white poverty. As Williamson writes, "the society [of poor whites] is broken." Conservatives' mental image of honest, hard-working, religious, close-knit communities of poor white families is finally dying the death it should have died twenty years ago (the death if would have died if conservatives watched Michael Moore's film Roger & Me, or the show Cops). But Williamson looks beyond cultural pathologies and sees the real pain of pure economic deprivation. Hopefully, conservatives will now take the next step and realize that it's not just the indigent towns of Appalachia, but most whites in America's "working-class" suburbs, who are experiencing these social and economic problems. But anyway, that leaves the question of what to do about the poverty. Williamson is not a fan of welfare:
Reich: Policies to Help Poor Could Be Boon for Big Business - Want to be a U.S. lawmaker considered friendly to big business? You should probably support raising the minimum wage and helping the unemployed, former Secretary of Labor Robert Reich said Thursday. Turning conventional Washington wisdom on its head, Mr. Reich told a congressional panel that policies usually trumpeted by Democrats to help the poor could actually be a huge boon for big business. “What is a business friendly strategy to create jobs? It’s to create customers,” he told the Joint Economic Committee. “Business executives and Wall Street traders are not job creators. The job creators are customers and if the vast middle class and the poor don’t have enough money in their pockets they can’t be customers.” That’s not an argument frequently heard in the halls of Congress, where the debate over issues like the minimum wage boils down to “it must be bad for employers if they have to pay more in wages.” But in his testimony, Mr. Reich said that rising economic inequality doesn’t just hurt those at the bottom of the economy. It can also undercut the economy as a whole, hurting business interests and the executives that run them, said Mr. Reich, who headed the Labor Department under former President Bill Clinton and now is a public policy professor at the University of California Berkeley. “One reason the recovery is so anemic is that 95% of the gains since the recovery started have gone to the top 1%. There’s no way that the middle calls or those that aspire [to the middle class] have enough purchasing power to keep the economy going,” he said.
No, we don’t spend $1 trillion on welfare each year --If you’ve read any conservative commentary on the war on poverty in the past week, you’ve likely seen this talking point: “We spend $1 trillion each year on welfare and there’s been no reduction in poverty.” Then, a sentence later, you’ll probably see a line like this: “According to a recent report, we spend a trillion dollars on means-test programs each year, yet the official census numbers show no reduction in poverty.” If you are reading that second line quickly, you probably think it bolsters the credibility of the first line. It’s an “official” number, and the census and the report probably quote accurate numbers too, night? They do, but the second sentence is actually used as an escape hatch to say something that isn’t true. We don’t spend anywhere near a trillion dollars on welfare unless you mangle the term “welfare” to be meaningless, and we do reduce poverty. First, Dylan Matthews has already dissected the claim that poverty hasn’t declined. It has. It’s just that the “official” poverty rate doesn’t factor in the earned-income tax credit or food stamps in its calculations. The claim about $1 trillion on “welfare” is more interesting and complicated. It shows up in this recent report from the Cato Institute, which argues that the federal government spends $668 billion dollars per year on 126 different welfare programs (spending by the state and local governments push that figure up to $1 trillion per year). So what should we take away from this? The federal government spends just $212 billion per year on what we could reasonably call “welfare.”
Welfare works for kids: Children whose parents get money grow up healthier and live longer. Welfare payments to the poor and jobless, for example, have often been unpopular in the United States because they are seen as subsidizing indolence or criminality. And even those most inclined to take a dim view of how poor adults ended up poor have to concede that poverty has blameless victims: children who had no role in deciding to have low-income parents. This is why protecting soldiers and mothers rather than childless civilians has long been the core focus of American social policy. And yet, while it’s easy to see that poverty is bad for children, it’s harder to know the extent to which anti-poverty programs succeed in ameliorating those ill effects. That’s in part because social programs are rarely designed to produce proper experiments. But it’s also because a human life takes decades to run its course. To really get a sense of long-term impacts, you need to wait a long time. That’s what makes new research into Mothers’ Pensions, one of America’s earliest welfare programs, so fascinating. Anna Aizer, Shari Eli, Joseph Ferrie, Adriana Lleras-Muney, and a team of research assistants took a detailed look at kids who grew up in Mothers’ Pension households and drew some conclusions about the long-term benefits of modest cash transfers. The program is old enough that almost all the kids whose moms received money are dead now, allowing the researchers to conclude definitively that it increased life expectancy. What’s more, World War II draft records show that poor kids whose moms received pensions were substantially healthier, had more years of schooling, and earned higher incomes than similar kids whose moms didn’t get pensions.
Doctors Slam Proposed Food Stamp Cuts: 'The Dumbest Thing You Can Do Is Cut Nutrition' -- Doctors have a message for congressional lawmakers inching toward a compromise farm bill that would cut food stamps by nine billion dollars: It’s a terrible idea. “If you’re interested in saving health care costs, the dumbest thing you can do is cut nutrition,” Dr. Deborah Frank of Boston Medical Center explained in an interview with the Associated Press. “People don’t make the hunger-health connection.” The Supplemental Nutrition Assistance Program (SNAP) offers benefits to over 47 million Americans. But the benefit level has fallen to the point that recipients only get about $1.40 per person per meal, even though food stamps often constitute the entirety of a family’s food budget. Doctors and researchers say that additional cuts on the horizon could increase the incidence of medical problems stemming in part from food insecurity, particularly diabetes and its related conditions.
Poverty Is Literally Making People Sick Because They Can't Afford Food - Income inequality is making us sick. Well, it's not making all of us sick. Only the poorest of us. That's what a new paper in Health Affairs by Hilary Seligman, Ann Bolger, David Guzman, Andrea López, and Kirsten Bibbins-Domingo found they looked at when people go to the hospital for hypoglycemia (low blood sugar). The basic idea is that people struggling to make it paycheck-to-paycheck (or benefits-to-benefits) might run out of money at the end of the month—and have to cut back on food. If they have diabetes, this hunger could turn into an even more severe health problem: low blood sugar. So we should expect a surge of hypoglycemia cases at the end of each month for low-income people, but not for anybody else. That's what researchers found when they looked at the numbers for California between 2000 and 2008. As you can see in their chart below, low-income people (red line) were <27 percent more likely to be hospitalized for hypoglycemia in the last week of the month than in the first. There was no week-to-week difference for high-income people (orange line).
Brown budget plan faulted on bullet train, teacher pensions - Gov. Jerry Brown's new budget proposal would continue to improve California's finances, but his plans for financing bullet train construction and a lack of new money for the cash-strapped teacher pension system are troublesome, the Legislative Analyst's Office said Monday. A report from the office, which provides nonpartisan budget advice to lawmakers, said Brown's $155-billion spending blueprint correctly emphasizes paying down debt incurred during state budget crises. "The governor's proposal would place California on an even stronger fiscal footing, continuing California's budgetary progress," the assessment said. And the state could see even more revenue than the administration projects, according to the report. But the extra money may not last, and Brown received praise for proposing a $1.6-billion deposit in the state's reserve fund as a buffer against future economic turbulence. "In general, setting aside money for a rainy day is exactly what the state should be doing when revenues are soaring, as they are now," the report said. But the analysis said the governor should put more money into the teacher pension fund. Administration officials estimate that the retirement system is underfunded by $80.4 billion. Brown has proposed only the state's regular $1.4-billion payment to that system in the next fiscal year, which begins July 1. State officials have said that it would take $4.5 billion a year for the next three decades to stabilize the pension fund.
Puerto Rico creditors meet on fears of debt moratorium - FT.com: Investors in Puerto Rico‘s debt, including hedge funds, are meeting in New York on Thursday with restructuring specialists as a moratorium on payments on the territory’s $70bn in public sector debt and an additional $40bn of unfunded pension liabilities appears increasingly likely, these specialists say. Puerto Rico’s government said on Wednesday it had not been invited to participate in the unofficial meeting, to be held at the offices of Jones Day, the law firm, adding that it would “take every step necessary to continue honouring its obligations”. “We [have] made significant progress in implementing our fiscal and economic development plans in 2013, and are determined to continue that progress in 2014,” it said. Any possible moratorium on debt payments would come despite the progress Puerto Rico’s governor Alejandro Garcia Padilla has made in raising taxes and reducing the territory’s deficit. Puerto Rico’s status as an unincorporated territory makes a Chapter 9 filing for bankruptcy protection for local governments, such as the Detroit municipal filing last July, impossible. That situation complicates any negotiations with creditors.
Detroit’s art—and its public worker pensions—get help from charitable foundations - There may be a little bit of good news on the horizon for the city of Detroit: Nine foundations, many with ties to Michigan — including the Ford Foundation, the Kresge Foundation and the John S. and James L. Knight Foundation — have pledged to pool the $330 million, which would essentially relieve the city-owned Detroit Institute of Arts museum of its responsibility to sell some of its collection to help Detroit pay its $18 billion in debts. In particular, the foundation money would help reduce a portion of the city’s obligations to retirees, whose pensions are at risk of being reduced in the bankruptcy proceedings. By some estimates, the city’s pensions are underfunded by $3.5 billion. As part of the plan, which negotiators have been working on quietly for more than two months, the museum would be transferred from city ownership to the control of a nonprofit, which would protect it from future municipal financial threats. The foundations would stipulate that Detroit must put the money into its pension system, said Alberto Ibargüen, president of the Knight Foundation. Whether having charitable foundations involved in this way is a good precedent is open for debate, but protecting the pensions of Detroit's workers, at least a little, and keeping the city's art from being sold off are both good ends. But $330 million isn't all that's needed, and in an editorial, the Detroit Free Press pressures the state to do the right thing:
For Scranton residents, bankruptcy is an inviting option - When Detroit filed for bankruptcy, hundreds of residents took to the streets to protest what they saw as a drastic approach to fixing the city's budget problems. But in this hilly town of 76,000 in northeastern Pennsylvania, residents have a different view of Chapter 9: They want the city to declare bankruptcy. And soon. "The silent majority would like to see bankruptcy," said Bob "Ozzie" Quinn, president of the Scranton and Lackawanna County Taxpayers Assn. "Basically, it's down to a point where people cannot afford to pay the taxes and are moving out of town." The City Council, which in 2012 passed a 5% amusement tax on live entertainment, is now discussing a 10% drink tax. The city's parking authority is in receivership, and it recently privatized its parking meters: The company in charge upped rates and extended meter hours to 6 p.m., which bar owner Mert Gavin says has motivated workers to skip happy hour and head home to the suburbs straight after work. "I am one of the last two bars that's still downtown. Tink's is gone. Whistle's is gone, Banshee's is gone, Molly Brannigan's is gone," said Gavin, who runs Mert's. "Do they expect I'm going to bail the city of Scranton out myself?"
Texas Public Schools Are Teaching Creationism - When public-school students enrolled in Texas’ largest charter program open their biology workbooks, they will read that the fossil record is “sketchy.” That evolution is “dogma” and an “unproved theory” with no experimental basis. They will be told that leading scientists dispute the mechanisms of evolution and the age of the Earth. These are all lies. The more than 17,000 students in the Responsive Education Solutions charter system will learn in their history classes that some residents of the Philippines were “pagans in various levels of civilization.” They’ll read in a history textbook that feminism forced women to turn to the government as a “surrogate husband.” Responsive Ed has a secular veneer and is funded by public money, but it has been connected from its inception to the creationist movement and to far-right fundamentalists who seek to undermine the separation of church and state.
No books, no clue at city’s worst school -- Students at PS 106 in Far Rockaway, Queens, have gotten no math or reading and writing books for the rigorous Common Core curriculum, whistleblowers say. The 234 kids get no gym or art classes. Instead, they watch movies every day. “The kids have seen more movies than Siskel and Ebert,” a source said. The school nurse has no office equipped with a sink, refrigerator or cot. The library is a mess: “Nothing’s in order,” said a source. “It’s a junk room.” No substitutes are hired when a teacher is absent — students are divvied up among other classes. A classroom that includes learning-disabled kids doesn’t have the required special-ed co-teacher. About 40 kindergartners have no room in the three-story brick building. They sit all day in dilapidated trailers that reek of “animal urine,” a parent said; rats and squirrels noisily scamper in the walls and ceiling. But five months into the school year, PS 106 classes still don’t have the books or teacher’s guides. “They have no reading program, no math program,” a source said, adding Sills blames outside administrators for not sending materials. Teachers muddle through by printing out worksheets they find online, buying their own copy paper.
Death threats for researcher who demonstrated college athletes read below a third-grade level -- According to a CNN report, the woman who revealed that 10 percent of the student-athletes at the University of North Carolina are reading below a third-grade level has been the subject of multiple death threats. Worse still, Mary Willingham told CNN, UNC has refused to support the findings of a study it asked her to conduct. According to Willingham, when CNN asked her for data about the scholastic aptitude of student-athletes, she provided the network with information that UNC had collected. “It’s in their system,” she said. “They have all the data and more. It belongs to them, and they paid a lot of money for it.” UNC claimed otherwise, writing in a statement that “[u]niversity officials can’t comment on the statistical claims mentioned in the story because they have not seen the data.”
For Recent Grads, Good Jobs Really Are Hard to Find - Anecdotal accounts of young college grads working as baristas, bartenders or retail clerks are widespread, provoking questions about the economic logic of going to college, particularly if doing so means taking on a lot of debt.Now come some economists from the Federal Reserve Bank of New York with evidence that college grads between 22 years old and 27 years really are finding it tougher to find jobs that require a bachelor’s degree than has been the case in the past. “Such difficulties are not a new phenomenon,” the economists say in an essay published in the New York Fed’s latest Current Issues. “Individuals just beginning their careers often need time to transition into the labor market.” But that transition has been becoming more difficult for the past 15 years, they say. “Job prospects for recent college graduates have indeed worsened.” Using Census Bureau and Labor Department data, the economists find that the fraction of college grads between 22 and 27 who were working in jobs that don’t generally require a bachelor’s degree rose to 46% during the 1990-91 recession, fell significantly during the 1990s boom and was down to 34% by 2001. This “underemployment rate” rose sharply after the 2001 recession and rose further after the 2007-09 recession, the economists find. It stood at 44% in 2012. Underemployment is most acute for those immediately out of college: 56% of 22-year-old college grads in 2009-2011 were working in jobs that didn’t require college degrees, substantially higher than in 1990 and in 2001. Historical data suggest many of them will find better jobs before they turn 30.
College Grads Are Elbowing Aside Less Educated for Jobs: It’s no secret that young Americans with a college degree have an easier time finding jobs than those with only a high school diploma. Last year, the unemployment rate for young adults with only a high school diploma was almost 10 percentage points higher than for those with a bachelor’s degree. Yet their success in the job market often came from lowering their sights and elbowing aside less educated people to take lower-skilled positions they once might not have pursued. In what is being called the “Great Squeeze,” college graduates are squeezing out other young adults with more modest educational records. Since 2009, many of the occupations with the fastest employment gains for young people have been lower-skill jobs that typically pay less, according to a new report by economist Diana G. Carew of the Progressive Policy Institute. Production, health care support and food preparation and serving occupations were the three main occupational groups to see gains for young Americans across all levels of educational attainment. The downside is that all three groups have mean hourly earnings significantly lower than the national average for all occupations. Notably, young college graduates saw a 15 percent increase in office and administrative employment while more generally employment in this group declined, the report stated. “This is consistent with the argument that young college graduates are struggling with high underemployment,” Carew wrote – and in the process are squeezing their less educated rivals aside.
Essay calls for reform of tenure and promotion system - Inside Higher Ed - For the last 15 years, I have studied academic reward system change in such areas as redefining scholarship, post-tenure review, stopping the tenure clock, and efforts to include ways to appraise new and diverse approaches to scholarly dissemination in the tenure process. My work has caused me reflect on the current state of dominant academic reward systems, the assumptions that guide them, and the specific things I would like to see colleges and universities NOT do anymore, and start changing. As a preamble to what I want us not to do anymore, I set forth the following principles. Most colleges and universities are charged with the goal of advancing knowledge within and through a diverse, inclusive community. By inclusive, I mean inclusive of both diverse individuals and diverse contributions to knowledge. Second, academic reward systems are about the valuing of professional lives and contributions. They are symbolic and concrete artifacts of what an institution values and aspires to become. Third, academic reward systems should ensure that faculty making excellent contributions to scholarship, teaching, and service should be retained and advanced. Yet what excellence looks like in 2013 may differ from what it looked like in 1960 and 50 years from now.
Services for seniors in danger as sequester cuts remain in place - Hot meals and homebound care are a small component of the range of services that the center — one of 250 in operation around New York — offers to the city’s growing elderly population. Every day, thousands of seniors flock to the centers to partake in yoga-for-arthritis classes, fitness training, computer training and arts-and-crafts lessons or just to have some company and a nutritious lunch. The demand for such services is increasing as the city experiences an aging boom, but years of stagnant funding and now the federal sequester cuts are making providers nervous. Some fear that if the squeeze on funding continues, disaster could lie ahead.“Every year, agencies have more people to serve with the same money or less,” . “Without adequate funding, we just can’t keep pace with demand.” It is not only New York. Across the country, many service providers are feeling the same anxiety. A survey (PDF) in November from the National Association of Area Agencies on Aging (N4A) to assess the impact of reduced federal spending on the elderly population in nine states found that 96.7 percent of respondents were concerned about the ability of seniors to continue living independently if current funding levels do not rise. Although 60 percent of service providers managed to come up with some funds to reduce the impact of the first round of sequester cuts in 2013, the majority say those alternative funds will not be available after 2014 and critical services are already being cut. The result: 36.7 percent of respondents said they are reducing caregiver programs, 50 percent are reducing transportation services, and a whopping 73.3 percent are reducing nutrition services, including meals on wheels.
Retirement Sunset Math: Number of Employed vs. Population Over Time -- As we face retirement sunset demographics, inquiring minds might be wondering how many people are left to foot the bill for retiree Medicare, health care, public union pensions, and Social Security promises vs. the number of people collecting benefits. The following charts from reader Tim Wallace will help put things into perspective. The above chart is just federal spending. It does not include state and local pension promises or healthcare costs If you think promises made cannot possibly be kept, even with huge tax hikes, you are thinking correctly.
Make Wealthy Pay Social Security Taxes on Their Full Salaries -- and Retirement Benefits Could Likely Be Expanded for All - According to RT.com, the 900 wealthiest Americans paid their full Social Security tax obligation for 2014 by January 2nd. How is that possible? As BuzzFlash at Truthout has pointed out before, there is an inexplicable cap on collecting Social Security tax above an income of $117,000 a year. Most payrolled Americans pay 6.2 percent of their income into the Social Security Trust Fund (the employer pays another 6.2 percent). But if you are a high-flying CEO who earns $50 million a year, $49,883,000 of your income is exempt from Social Security taxes. If the wealthy paid Social Security taxes on their full salaries (and we aren't even talking stock options and other forms of bonuses that are not subject to Social Security taxation) the Social Security Trust Fund would likely be able to expand benefits. This would be a far cry from the ongoing right wing -- and White House -- efforts to reach a "grand bargain" on cutting Social Security benefits (even though there is no immediate crisis and any problems that do exist largely result from the government borrowing from the fund).
Why Paul Krugman is Wrong to Push Medicaid as the Remedy to Health Care Costs -- Paul Krugman suggests in his New York Times column today that continuing the expansion of Medicaid is the answer to the outlandish cost of health care in the United States. He’s wrong. Medicaid is a lifeline for the impoverished, but the program would have to be reformed to the point that it would no longer be recognizable as Medicaid to be satisfactory for most Americans. The reason Krugman likes Medicaid is the program’s success at controlling costs. He says that of all the health care delivery systems in the country, Medicaid is the one most like those in Europe, which have much lower costs than ours. If that’s true, it’s only because most of the rest of our fragmented system is completely fucked up. Among the primary aims of European systems is health care equity — providing everybody with the same access to high-quality health care regardless of income or station. Medicaid does not come close to doing that. Krugman says that care from Medicaid providers is good and that lack of access is greatly exaggerated. In my experience the former is sometimes true and the latter, never.
Nightmare Tennessee bill could force hospitals to ban only Obamacare website users --Tennessee lawmakers who are doing their best to stop President Barack Obama’s health care law have introduced a bill that could have the unintended consequence of forcing hospitals to verify and ban patients if they purchased insurance through the Healthcare.gov website. At a press conference on Wednesday, state Sen. Mae Beavers (R) and state Rep. Mark Pody (R) announced legislation that would prevent any state agency from cooperating in any way with the Affordable Care Act. “The federal government does not have constitutional authority to commandeer state and local governments to enforce or implement these federal health care mandates,” Beavers explained. “This legislation takes a very strong stand to resist this federal overreach of power.”
Obamacare Outsourced -- The Obama administration has offshore outsourced Obamacare. They made Accenture the lead contractor for the website healthcare.gov. The contract is estimated to be worth $90 million and the original contractor, CGI Federal, is out. We pointed out earlier that the failed Obamacare website was poetic justice as CGI Federal is also an offshore outsourcer of U.S. jobs. But now the poster boy for labor arbitrage, offshore tax havens, and bloated, often failed government contracts is in charge, Accenture.Accenture is one of the biggest offshore outsourcers of American jobs. In 2012 they used 4,037 H-1B Visas alone and are ranked #5 in using foreign guest workers to displace U.S. workers and offshore outsource jobs. The H-1B Visa is known as the offshore outsourcing Visa. Offshore outsourcers use this Visa in a notorious method to displace Americans and technology transfer large projects to cheap labor nations.In 2012, the 10 employers receiving the largest number of H-1B visas were all in the business of outsourcing and offshoring high-tech American jobs. Many of the jobs that went to H-1B workers should have instead gone to U.S. workers, but employers are not required to recruit them before applying for an H-1B, and can even replace their U.S. workers with H-1Bs. Accenture has more workers in India than any other nation. In 2012 they had 80,000 Indian workers, 35,000 in the Philippines and only 40,000 in the United States. In all probability, those tech jobs just awarded under this contract and paid for with U.S. citizen tax dollars are in India or being done by imported foreign workers from India on guest worker Visas.
Older, costlier crowd leading health insurance sign-ups - It’s an older, costlier crowd that’s signing up so far for health insurance under President Barack Obama’s law, according to government figures released Monday. Enrollment is lower for the younger, healthy Americans who will be needed to keep premiums from rising. Young adults from 18 to 34 account for only 24 percent of total enrollment, the administration said in its first sign-up figures broken down for age, gender and other details. With the HealthCare.gov website now working, the figures cover the more than 2 million Americans who had signed up for government-subsidized private insurance through the end of December in new federal and state markets. Enrolling young and healthy people is important because they generally pay more into the system than they take out, subsidizing older adults. While 24 percent is not a bad start, say independent experts, it should be closer to 40 percent to help keep premiums down. Adults ages 55 to 64 were heavily represented in the sign-ups, making up 33 percent of the total. Overall, the premiums paid by people in that demographic don’t fully cover their medical expenses. Some are in the waiting room for Medicare; that coverage starts at age 65.
Young adults make up one-fourth of Obamacare enrollees - Just under a quarter of Obamacare sign-ups so far have been in the critical 18-to-35-year-old age range, the Obama administration revealed Monday, the first time officials have given demographic data about health plan enrollees. The administration had set a goal of around 38 percent to 40 percent of the enrollees in that age bracket by the time the sign-up season ends March 31. The administration’s monthly enrollment update showed 2.2 million people had picked health plans in the federal or state health exchanges from Oct. 1 through Dec. 28. It’s not yet clear how many have paid their first monthly premium, a requirement before coverage can begin. An additional 3.9 million people have been deemed eligible for Medicaid. More than half of those who have signed up are between 45 and 64, an age range that tends to be sicker and costlier to cover, according to the enrollment figures released Monday by the Department of Health and Human Services. Young adults have to sign up in sufficient numbers to keep premiums in check and the health insurance market stable. Administration officials say the trends are going in the right direction at the midway point in enrollment. “We are confident, based on the results we have now that we’ll have an appropriate mix,” The HHS data also showed that nearly four in five of the new sign-ups have been deemed eligible for premium subsidies.
The Real Health Care 'War' on the Young - A common theme among critics of Obamacare has been that it basically is a war on the young and especially on men. “Why aren’t Millennials marching in the street over Obamacare?” asks Chris Conover, a policy analyst at Duke University, in Forbes. “Anyone with a conscience should be offended by the greatest generational theft ever witnessed in the history of the world. Young Americans – especially the Millennial generation born between 1977 and 1995 – are the biggest losers in this battle, but it will adversely affect their children and grandchildren to boot.” The most seriously victimized by Obamacare, its critics say, are men. Possibly inspired by John Goodman’s column “Obama’s War on Men” on the National Center for Policy Analysis health care blog, Avik Roy, a Forbes columnist and Manhattan Institute senior fellow, metaphorically described Obamacare in a Fox News interview as a “war on the bros.” The destructive weapon supposedly wreaking this havoc on the young and the “bros” is the “adjusted community rating” that the Affordable Care Act imposes on the market for health insurance policies sold to individuals or small groups (mainly the employees of small businesses). Although the act allows insurers to vary their premiums by age up to a ratio of 3 to 1 and to charge smokers 50 percent more than nonsmokers within an age group – hence the term “adjusted” community rating — premiums may no longer be based on the health status of individuals within age bands nor on their gender.
The Spanish Version of Healthcare.gov is Terrible - It sounds like the Spanish version of Healthcare.gov was basically created by a middle school student who only realized at midnight there was a Spanish class assignment due the next day. From ABC News:A Web page with Spanish instructions linked users to an English form.And the translations were so clunky and full of grammatical mistakes that critics say they must have been computer-generated — the name of the site itself can literally be read “for the caution of health.” “When you get into the details of the plans, it’s not all written in Spanish. It’s written in Spanglish, so we end up having to translate it for them,” said Adrian Madriz, a health care navigator who helps with enrollment in Miami. This is just unacceptable. The early technical problems when designing a massive new data base are at least understandable given the complexity of the issues involved. Not taking the time to hire a handful of professional Spanish translators to go over the site is just incomprehensible. There is no excuse for this stupid of a mistake on such an important of a project
Obamacare horror stories -- Maggie Mahar at healthinsurance.org takes a look at stories easily fact checked in Anatomy of an Obamacare horror story For months, health reform’s opponents have been feasting on tales of Obamacare’s innocent victims – Americans who lost their insurance because it doesn’t comply with the ACA’s regulations, and now have to shell out more than they can afford – or go without coverage. Trouble is, many of those stories just aren’t true.… The paper describes them as among Obamacare’s “losers,” but the truth is that they didn’t want to be winners. Two hadn’t even attempted to check prices in the exchanges.Meanwhile, it appeared that no one at the Star-Telegram even attempted to run a background check on the sources, or fact check their stories. I couldn’t help but wonder: “Why?” The answer will surprise you. To this day – more than a month after the story appeared – the Star-Telegram still hasn’t told its readers that Johnson had found affordable coverage or that under Obamacare, no 20-something – including Johnson – will be charged $1,000 a month.
Ads Against Health Law Backers Stagger Outspent Democrats — Democrats are increasingly anxious about an onslaught of television ads hitting vulnerable Senate and House candidates for their support of the new health law, since many lack the resources to fight back in the early stages of the midterm campaign. Since September, Americans for Prosperity, a group financed in part by the billionaire Koch brothers, has spent an estimated $20 million on television advertising that calls out House and Senate Democrats by name for their support of the Affordable Care Act. The unusually aggressive early run of television ads, which has been supplemented by other conservative initiatives, has gone largely unanswered, and strategists in both parties agree it is taking a toll on its targets. Related Coverage Conservative Group to Air Ads Attacking Health Law in Michigan and IowaJAN. 14, 2014 Building on the success, the deep-pocketed organization disclosed on Tuesday that it was expanding its Senate efforts with $1.8 million in airtime to attack Democratic House members running for the Senate in Iowa and Michigan, where Democrats are viewed as holding an early advantage. The group was also moving into Montana, a state where Democrats may struggle to defend a seat, on behalf of a Republican House member running for the Senate.
Yes, Virginia, there really IS a rapidly-increasing possibility of a Healthcare Insurance Public Option. (The private insurance companies are inviting it.) - Beverly Mann - Late this month, in his State of the Union address, Obama will discuss Obamacare. He will use the tired-but-by-now-obligatory tactic of having real Americans in the audience, whom he will name and whose family is benefiting tremendously from the law. What he won’t do, though, is what most he should do: Explain, in actual detail, using genuine specific data depicted in charts, that the unremitting trends in healthcare insurance ever-narrowing provider networks and increasing premiums and out-of-pocket costs in both the individual market and the employer-based group-insurance market. And to say that it soon will be clear whether or not the private for-profit healthcare-insurance market can meet the needs of the general public or whether instead that can be accomplished only through a government-run single-payer insurance system or some other non-profit system similar to one or another system that works so well in, say, Australia, France, or Germany. And then propose a public option, not just for the individual market but also for employer-based group insurance. No, Obama himself won’t propose this. But progressive Democratic congressional candidates should, and soon. Obama, like most Washington pols and almost all political pundits, is always incredibly late to the change-in-progressive-and-mainstream-political-winds party. If he ever arrives at the party at all. The Washington Post piece notes that most of the small-business-group policy cancellation notices will be sent in October, near the start of the open-enrollment period and also just before the midterm elections. This, the writer points out, “could be difficult for Democrats who are already fending off Republican attacks about the Affordable Care Act and its troubled rollout.”
Obamacare Enrollments Show Low Uptake by Uninsured, Hoisting Insurers on Their Own Petard - Yves Smith - One of the few saving graces is that the health insurers’ scheme to enrich themselves known as Obamacare may be going pear-shaped from the standpoint of their profits. First we had the mess of the Healthcare.gov website, and recall that fixing the back end was lower priority than improving the much-higher-profile consumer experience. So insurers had to process a lot of completed applications manually, which imposed unexpected costs on them. Second, many of the initial enrollees (and presumably a not-trivial proportion of the later ones) were assumed to have pre-existing conditions, as in have costly ailments that had gotten them denied. While insurers did expect to have that population sign up, they didn’t plan on them being vastly more enthusiastic about Obamacare than other target populations, since it would create an significant adverse skew in the insured population, potentially leading to a death spiral (in general, if an insurance pool does not have enough good risks to compensate for the poor ones, the cost of insurance is so high that the good risks drop out because the insurance is clearly uneconomical for them, leading to further rate increases and more thinning of the better risks). The Wall Street Journal tells us that Obamacare looks to be falling short of insurers’ fond hopes on a third front, that of the level of participation by the uninsured. Remember, even after Obamacare, many uninsured were expected to remain uninsured, due to the fact that some low and moderate income individuals eligible for subsidies would still find the cost to them too high. Brookings last September summarized the projections: of 60 million uninsured, 17 million would obtain insurance via Medicaid expansion. Of the remaining 43 million, 22 million, or roughly half, were expected to sign up, leaving 20 million, or roughly half, still without coverage.
Will we be bailing out the insurance companies? - This is the plan that Republicans hope to cleverly foil by framing the risk-adjustment provisions [of ACA] as an insurer bailout and repealing them. As designed, the risk-adjustment mechanism was supposed to be revenue-neutral, and that is how the Congressional Budget Office scored it in their last estimate. But unless the demographics of the exchanges improve pretty quickly, the three temporary risk-adjustment programs are probably set to transfer a large hunk of cash to the insurance companies. That’s what the administration, and the insurers, want to happen; it’s how they are going to keep the insurers on board for 2015. Phil Klein at the Washington Examiner points out that Humana Inc.’s latest filing with the Securities and Exchange Commission warns of a “more adverse than previously expected” mix of customers enrolling through the exchange — but it doesn’t change its earnings forecast for 2014. So either it thinks its losses will be trivial relative to overall earnings or Humana thinks the chances of a bailout from the administration are basically 100 percent. There is more here, including background context if you are not up to speed on this issue.
Why French Kids Don’t Have ADHD - In the United States, at least 9% of school-aged children have been diagnosed with ADHD, and are taking pharmaceutical medications. In France, the percentage of kids diagnosed and medicated for ADHD is less than .5%. How come the epidemic of ADHD—which has become firmly established in the United States—has almost completely passed over children in France? Is ADHD a biological-neurological disorder? Surprisingly, the answer to this question depends on whether you live in France or in the United States. In the United States, child psychiatrists consider ADHD to be a biological disorder with biological causes. The preferred treatment is also biological--psycho stimulant medications such as Ritalin and Adderall. French child psychiatrists, on the other hand, view ADHD as a medical condition that has psycho-social and situational causes. Instead of treating children's focusing and behavioral problems with drugs, French doctors prefer to look for the underlying issue that is causing the child distress—not in the child's brain but in the child's social context. They then choose to treat the underlying social context problem with psychotherapy or family counseling. This is a very different way of seeing things from the American tendency to attribute all symptoms to a biological dysfunction such as a chemical imbalance in the child's brain.
Science: can emotions be inherited? - FT.com: Researchers have transmitted fear of a specific smell down two generations of mice, using a mechanism of inheritance that responds directly to environmental factors. They say a similar effect may be significant in some human psychiatric disorders. The study at Emory University in Atlanta is one of the most striking demonstrations so far of “epigenetics”, a phenomenon causing increasing excitement among evolutionary biologists. It involves biochemical marking of DNA in response to experience, in a way that may affect the activity of genes for several generations. The scientists made laboratory mice fear the odour of acetophenone, which is rather like cherry blossom, by giving them a mild electric shock whenever they were exposed to it. They then found that the offspring of these sensitised mice recoiled when they first smelled it, although they were conceived by in-vitro fertilisation and had no contact with their parents. The sensitivity even appeared in the second generation.
Major California Drought Could Spell 'Catastrophe' for Nation's Food Supply -- A major and unyielding drought in California is causing concern in the nation's "food basket," as farmers there say the U.S. food supply could be hit hard if the conditions in their state don't rapidly improve, Al Jazeera America reports Tuesday. "This is the driest year in 100 years,” According to the U.S. Drought Monitor, 2013 was the driest on record for most areas of California, "smashing previous record dry years" across the state, including regions where approximately half the fruits, vegetables and nuts in the U.S. are grown. Those conditions have not relented as 2014 begins with most of the state experiencing official 'severe' or 'extreme drought' conditions. And as Al Jazeera reports, reservoirs, which store water that flows from the snow pack in the Sierra Nevada mountains, are at less than 50 percent capacity—20 percent below average for this time of year. “That’s rather dismal,” said Nancy Vogel, spokeswoman for the California Department of Water Resources. “If we don’t get big storms to build up that snow pack, we can’t expect much in reservoirs.”
California faces water shortages and wildfires as “mega-drought” gets even worse - The year 2013 was California’s driest on record, featuring the least rainfall since the state started keeping track in 1849. And so far, 2014 is off to a bad start.A full 63 percent of the state is in extreme drought conditions, according to the U.S. Drought Monitor — up from 23 percent just last week and extending into northwestern Nevada. Precipitation for the water year (which begins October 1) is less than 20 percent of normal levels in the areas of most extreme drought. Up in the Sierra Nevada mountains, snowpack — a major repository for the state’s water supply — is between 10 and 30 percent of normal, with many locations now in the bottom 5th percentile. Two of the state’s lakes are only 36 percent full; the San Luis Reservoir in Central Valley is down to 30 percent. “It’s really serious,” Gov. Jerry Brown said Monday. “In many ways it’s a mega-drought; it’s been going on for a number of years.” Any day now, he’s expected to announce that California is officially in the midst of a drought. Citing the dry conditions and gusty winds, a meteorologist warned Tuesday that the fire danger in many parts of Los Angeles and Ventura counties is “about as high as it can be,” a prediction borne out Thursday when a massive wildfire ignited 40 miles east of downtown L.A. Three people were arrested in connection with the blaze, which scorched over 1,700 acres and destroyed at least two homes.
America's Forest Carbon Sink Is Shrinking, Government Report Says - America's forests seem likely to scrub much less carbon dioxide out of the atmosphere in the future compared to the last few decades, according to a government report submitted last week to the United Nations. Although the timing and extent of the shift is hard to pin down, the expected change could make it harder for the United States to meet its commitments to control CO2, the principal greenhouse gas that is warming the planet. In recent years, the nation's forests have been growing. The density of their trees has increased as growth exceeded harvests, and there have been small annual increases in the area of forested land. But the beneficial trends are expected to slow, and ultimately to reverse, the report warned. "In the long term, U.S. forest carbon stocks are likely to accumulate at a slower rate, and eventually may decline as a result of forestland conversion and changes in growth related to climate change and other disturbances," the report said. "U.S. forests are unlikely to continue historical trends of sequestering additional carbon stocks in the future under current policy conditions," it added. "These changes may already be starting," the report warned, although it will take years to collect the data to know for sure. In a cover letter, Secretary of State John Kerry said the costs of inaction on climate change are "beyond anything that anyone with conscience or common sense should be willing to contemplate."
Wikileaks on the Trans-Pacific Partnership Environment Chapter: “Toothless Public Relations Exercise” - Yves Smith - Wikileaks has thrown yet another wrench in the negotiations over the sellout-to-multinationals-masquerading-as-trade-deal otherwise called the Trans-Pacific Partnership. Wednesday, on the eve of an expected-to-be-contentious Senate Finance Committee hearing on the Administration’s request for “fast track” authority for the TPP, Wikileaks released another important draft chapter from the pact, this on environmental regulations. Wikileaks also published an analysis by Professor Jane Kelsey of New Zealand. Given how difficult it is to parse the text (particularly since one also needs to understand how its provisions relate to other international agreements to appreciate the significance), her report provides a good, technical overview. The main points of her analysis of the chapter proper are that despite aspirational language, the draft chapter has few definitions of key terms and has no mechanism for providing penalties. The one stab at defining terms is “environmental laws” and that is narrow, including only environmental protection and human health and safety. It excludes prudent resource management practices and also appears to impinge on the UN Declaration on the Rights of Indigenous Peoples, which all parties to the pact save the US have signed. Among other things, it protects the rights of indigenous people over traditional knowledge, specifically: …genetic resources, seeds, medicines, knowledge of the properties of fauna and flora…and … the right to maintain, control, protect and develop their intellectual property over such cultural heritage, traditional knowledge, and traditional cultural expressions. Seeds? Monsanto is going to cede control over seeds to savages indigenous people? Similarly, Big Pharma has been scouring exotic locations to try to find new molecules and treatments to exploit. It would be a shame if pesky natives stood between them and their profits. You can see why the Administration keeping these notions out of the text. Professor Kelsey also notes that she is reading this chapter in isolation, she can’t tell how conflicts between chapter will be resolved, but she can see there are plenty, most importantly with the investment chapter:
TPP: Poison for Local Community Resilience - The past couple of decades of globalization have been a disaster for planetary ecosystems, indigenous peoples, and most middle-class citizens, but a gravy train for big investors, investment bankers, and managers of transnational corporations. Economists said everyone would eventually benefit, but casualties quickly mounted. Inflation-adjusted wages for American workers stagnated. Manufacturing towns throughout the Northeast and Midwest withered. Meanwhile, China began burning immense amounts of coal to make mountains of toys, furniture, clothing, tools, appliances, and consumer electronics, cloaking its cities in a pall of toxic fumes and driving its greenhouse gas emissions to world record-setting levels. In effect, the United States has been importing cheap consumer goods while exporting jobs and polluting industries. In both China and the US, levels of economic inequality have soared. Now comes the Trans-Pacific Partnership (TPP), a new trade deal negotiated in secret (only corporations get to contribute to, and look at, the draft language). The point of the Treaty: to double down on globalization at precisely the moment in time when the entire enterprise is beginning to fail as a result of stubbornly high oil prices, worsening climate change impacts (floods, droughts, wildfires), debt deflation, and middle-class fears of losing even more ground.
2013 was Australia's Hottest Year, Warm for Much of the World -- The Bureau of Meteorology has confirmed 2013 as Australia’s hottest year since records began in 1910. Average temperatures over the continent have been 1.2C above the 1961-1990 average, breaking the previous record set in 2005 by 0.17C. It was also the hottest year on record for South Australia, Western Australia and the Northern Territory. The other states - Queensland, New South Wales, Victoria and Tasmania – recorded above-average temperatures that rank in their top four hottest years. The year got off to an exceptionally hot start with a heatwave that spanned most of the continent during the first three weeks of January. Numerous locations experienced their highest temperatures on record during this period, including Hobart (41.8C on January 4) and Sydney (45.8C on January 18). Moomba’s 49.6C on January 12 was the highest recorded temperature anywhere in Australia since 1998 and the highest in South Australia since 1960. Nationally, January 7 was Australia’s hottest day on record. January was the hottest month on record and the summer of 2012-13 was the nation’s hottest summer. The record year wasn’t simply a result of a hot January. Above average temperatures were unusually persistent throughout 2013, particularly between July and October. The unusual heat peaked in September when national mean temperatures were 2.7C above average, more than a degree above any previous September and further above average than any previous month in Australia’s climate history. Many parts of the central and eastern interior were as warm in September as they would be in an average November.
Australia’s 2014 Heat Wave Picks Up Where 2013 Left Off - The U.S. may just be climbing out of the freezer, but Australia has been sweating through a major heat wave to start the year. Heat records fell across a large part of the country in the first week of the New Year. The warm weather is currently centered over sparsely populated Western Australia, but it could hit major population centers along the east coast by late next week. The Australian Bureau of Meteorology released a special statement to chronicle the extent of the heat wave and its movement. While noting that it didn’t affect as wide an area as the January 2013 heat wave, the statement said the heat wave has been, “highly significant with substantial areas having their hottest day on record.” The heat wave comes on the heels of Australia’s hottest year on record during which a slew of records were shattered, including the country's hottest summer. During the most recent heat wave, dozens more records were set, including some by large margins. Narrabri, located about 320 miles northeast of Sydney, saw the thermometer hit an eye-popping 118°F on January 3. That surpassed the previous record by 6.5°F, which is the largest margin for an all-time high temperature record at an Australian weather station with 40 or more years of data. In Gunnedah Research Center, located 265 miles northeast of Sydney, temperatures rose to 114.6°F. That topped the previous high by 5°F. The station has records going back 76 years and is part of Australia’s long-term climate network. Overall, 34 locations across the country with 40 years or more of data had their hottest day on record.
Extreme Weather Wreaking Havoc on Food as Farmers Suffer - Too much rain in northern China damaged crops in May, three years after too little rain turned the world’s second-biggest corn producer into a net importer of the grain. Dry weather in the U.S. will cut beef output from the world’s biggest producer to the lowest level since 1994, following 2013’s bumper corn crop, which pushed America’s inventory up 30 percent. U.K. farmers couldn’t plant in muddy fields after the second-wettest year on record in 2012 dented the nation’s wheat production. “Extreme weather events are a massive risk to agriculture,” “Farmers can adapt to gradual temperature increases, but extreme weather events have the potential to completely undermine production. It could be drought, it could be too much rain, it could be extreme heat at the wrong time. It’s the extreme that does the damage.” Farm ministers from around the world are gathering in Berlin tomorrow to discuss climate change and food production at an annual agricultural forum, with a joint statement planned after the meeting. Fast-changing weather patterns will only become more commonplace, according to the New York-based Insurance Information Institute. While the world produces enough to provide its 7 billion people with roughly 2,700 calories daily, and hunger across the globe is declining, one in eight people still don’t get enough to eat, some of which can be blamed on drought, the United Nations said.
Parts of Europe ‘5°C Warmer’ by 2100 - —With exquisite timing, as parts of Europe endure the worst storms for decades, researchers have issued a highly topical warning. By the end of this century, they say, summer temperatures in parts of southern Europe are expected to be up to 5°C higher than they were from 1961 to 1990, with droughts inevitably becoming more frequent and intense, because of both climate change and increased water use. The researchers, from the European Commission’s Joint Research Centre (JRC) and the University of Kassel in Germany, have published their findings in Hydrology and Earth System Sciences, an open access journal of the European Geosciences Union (EGU). The scientific article is available online, free of charge. “Our research shows that many river basins, especially in southern parts of Europe, are likely to become more prone to periods of reduced water supply due to climate change”, says Giovanni Forzieri, a researcher in climate risk management at the JRC and lead author of the study. In Europe the cost of drought over the last three decades has totalled over €100 billion (£83 bn).
Researchers confirm: Warmer Pacific Ocean has increased cyclone risk for China, Japan and Korea --China, Korea and Japan have been placed in the firing line of powerful tropical cyclones by a warming of water in the western Pacific, according to a three-decade study published on Thursday. Researchers led by Chang-Hoi Ho from Seoul National University in South Korean looked at five sets of background data for tropical cyclones that occurred in the northwest Pacific between 1977 and 2010. During this time, the surface waters of the western Pacific were much warmer than the central and eastern parts of the ocean, they found. This temperature difference, also called a gradient, went hand-in-hand with changes to a strong wind system over the Pacific called the Walker circulation. The result was that cyclones tended to follow the line of the East Asian coast, from the South China Sea upwards, before making landfall in China, Japan and Korea — by which time they had reached their maximum punch. The change also meant that more cyclones generated in the northern part of the South China Sea. As a result, storms headed for southern China, Vietnam or Taiwan began life too close to land to build up to maximum speed by the time they reached the coast.
Study finds sea levels rising fast; concerns grow about Shore - As the planet warms, one of the biggest questions is how fast sea level will rise. A team of Rutgers University researchers has attempted to answer that question and localize it by studying past sea-level rise along the East Coast, as well as other factors that could influence what happens along the New Jersey Shore. In recently published studies, they conclude that sea level at the Shore - already rising faster than at any time in the last 4,300 years - could go up by 11 to 15 inches more than the global average by 2100. While levels worldwide will generally increase less than a foot by 2050, those at the Shore will likely rise 1.5 feet, according to a mid-range scenario. By 2100, local levels could climb 3.5 feet, bringing unprecedented flooding. The research "clearly indicates that New Jersey is one of the regions of highest concern in the United States, as far as risk from sea-level rise is concerned," said Ben Strauss, an expert at the independent research organization Climate Central in Princeton. "This is really about how soon - not whether - sea level will rise that much." Strauss was not involved in the Rutgers research. However, pairing it with his own analysis, he noted that Atlantic City alone has $23 billion worth of real estate sitting below a five-foot flood level. That magnitude could have a two-in-three chance of being seen in any given year by midcentury, according to the scientists' estimates.
Rising Seas, Sinking Coasts Spell Doom for Eastern US - The devastating impact of global warming induced sea level rise has become increasingly clear as powerful surges, coastal flooding and rapid erosion are more and more frequently wreaking havoc along the eastern seaboard of the United States. A new report published Tuesday by the New York Times explains that, as the waters continue to rise, the land along the East Coast is also sinking, spelling disaster for coastal communities. Accumulating scientific evidence suggests that the East Coast "will be a global hot spot for a rising sea level over the coming century," Scientists have discovered that an ice sheet, which blanketed the upper half of North America following the last Ice Age, had caused the land along the Eastern Seaboard to buckle and rise. The subsequent melting of that ice is now causing the adjacent land to fall, meeting the rising sea. The sinking, the New York Times reports, is occurring "all the way from southern Maine to northern Florida," and is most dramatic in the Chesapeake Bay region where whole island communities have already washed out to sea. Scientists estimate that since 1880, the global average sea level rose a little over eight inches. However, due to increasingly high levels of carbon pollution in the atmosphere, by 2100 that amount could surge to more than four feet over today's levels which—according to a study published earlier this year—at high tide could "submerge more than half of today’s population in 316 coastal cities and towns (home to 3.6 million) in the lower 48 states."
Antarctic glacier’s retreat unstoppable - For the past 15 years scientists have been observing that glaciers in West Antarctica are out of balance. Ice shelves have been breaking off and the calving fronts of the glaciers have been retreating, draining huge amounts of ice into the ocean.One of them is Pine Island glacier, which is responsible for some 20 percent of the total ice loss from the region. Gael Durand of the French University of Grenoble is one of a team of scientists who have just published a new study using three different models: "We show that the Pine Island Glacier will continue to retreat and that this retreat is self-sustaining. That means it is no longer dictated by changes in the ocean or the atmosphere, but is an internal, dynamic process", Durand told DW. This will mean an increasing discharge of ice and a greater contribution to global sea level rise. "It was estimated at around 20 gigatons per year during the last decade, and that will probably increase by a factor of three or five in the coming decade. That means this glacier alone should contribute to the sea level by 3.5 to 10 millimetres a year, accumulating to up to one centimetre sea rise over the next 20 years. For one glacier, that is colossal", the scientist said.
Massive Antarctic Glacier Has Entered Irreversible Melt, Could Add Up To 1 Centimeter To Sea Level - One of the latest indicators that climate change is progressing whether we’re looking or not comes from a study in the journal Nature Climate Change finding that one of the largest glaciers in Antarctica has started melting irreversibly. An international team of researchers found that Antarctica’s Pine Island Glacier, the single largest Antarctic contributor to sea-level rise, could add as much as one centimeter to ocean levels within the next 20 years. The glacier “has started a phase of self-sustained retreat and will irreversibly continue its decline,” Gael Durand, a glaciologist with France’s Grenoble Alps University, told Australian Broadcasting Corporation. The team of researchers used state-of-the-art ice-flow models and field observations to help determine how the glacier’s ice flows will change in coming years. “At the Pine Island Glacier we have seen that not only is more ice flowing from the glacier into the ocean, but it’s also flowing faster across the grounding line — the boundary between the grounded ice and the floating ice,” Dr. G. Hilmar Gudmundsson told Planet Earth Magazine.The glaciologists found that that glacier’s grounding line, which has already receded up to 10 kilometers this century, is “probably engaged in an unstable 40-kilometer retreat.”
Act Now or Pay the Heaviest Price, Warns Leaked Climate Report -- Hopes to reduce the worst impacts of climate change around the globe will likely be lost if the international community doesn't immediately switch to clean energy and significantly reduce carbon emissions, according to a leaked draft of a report being conducted by UN scientists at the Intergovernmental Panel on Climate Change. If "explicit efforts" are not immediately taken to reduce emissions, the scientists warned, future efforts will either be too costly or too late. Greenhouse gas emissions must be reduced by 40-70% of 2010 levels by 2050, a reduction that will not be met if the world continues to rely on fossil fuels such as oil and coal to power the energy needs of an exponentially growing population. As The New York Times reports: Nations have so dragged their feet in battling climate change that the situation has grown critical and the risk of severe economic disruption is rising, according to a draft United Nations report. Another 15 years of failure to limit carbon emissions could make the problem virtually impossible to solve with current technologies, experts found. [...] While the spread of technologies like solar power and wind farms might give the impression of progress, the report said, such developments are being overtaken by rising emissions from fossil fuels over the past decade, especially in fast-growing countries like China. And one of the most important sources of low-carbon energy, nuclear power, is actually declining over time as a percentage of the global energy mix, the report said.Carbon dioxide and other greenhouse gases emissions grew 2.2% per year on average between 2000 and 2010, the scientists note, in comparison to the 1.3% per year on average between 1970 to 2000.
Living in a world we can't understand - We live in an age of enlightenment, in the belief that the entire universe is open to our inspection and more than this, that it is theoretically all intelligible to us. If we just apply enough science and enough rationality, nature will reveal all its secrets to us in ordered sets of data that we can then use to control the entire world around us. That we can wrest a comfortable life from the Earth is, however, nothing special. Plants and animals do this without resorting to colleges, symposia or research laboratories. And, humans used to do it without these things as well. Ancient Greeks--if they survived childhood diseases, war and the occasional plague--regularly managed to live into their 60s and 70s among balmy Mediterranean breezes. It's not that there hasn't been any progress; it's just that we may not have made as much progress as we think. And yet, in the age of Big Data we have become ever more enamored with the representations of the world that we gather in the form of numbers and words, believing (wrongly) that the map is the territory.We tend to dismiss things we cannot understand: "If I cannot understand it, then it must not exist." And there is the seemingly less pernicious, "If I cannot understand it, it must not be important."The second notion is actually more pernicious. I can show convincingly that a person who does not understand a well-supported fact is merely ignorant. But it is much harder to convince someone that something which he or she doesn't understand--but doesn't deny either--is actually important enough to pay attention to. Climate change comes to mind.
Global warming is being caused by humans, not the sun, and is highly sensitive to CO2, new research shows - Over the past few weeks, several important new papers related to human vs. natural climate change have been published. These papers add clarity to the causes of climate change, and how much global warming we can expect in the future. First, a paper published in the Journal of Climate examines the recent IPCC statement that expressed with 95 percent confidence that humans are the main cause of the current global warming. The first model assumed that there is short persistence in the internal variability, therefore the present climate is mostly determined by the recent past and there is a finite time scale beyond which the memory of the system is lost. The second model assumed that the climate's internal variability has long persistence and the present climate is influenced by all the previous years with no finite time scale beyond which the memory of the system is lost.As lead author Jara Imbers told me, "...we investigate two extreme cases of the plausible temporal structures of the internal variability, and we find that the anthropogenic signal is robust and significant." Second, a paper published in Nature Geoscience investigates the sun's influence on global climate changes over the past 1,000 years. Although we know the sun can't be causing the current global warming because solar activity has declined slightly over the past 50 years, "it's the sun" nevertheless remains one of the most popular climate contrarian arguments. In this study, the authors tested reconstructions with relatively high and low changes in solar activity, and compared them to northern hemisphere temperature reconstructions over the past millennium. The reconstruction using relatively high solar activity and a stronger solar influence (green) was a worse fit to the temperature data (blue) than the reconstruction with the weaker solar influence (red), especially around the 12th century.
About that consensus on global warming: 9136 agree, 1 disagrees. -- I just want to highlight this illuminating infographic by James Powell in which, based on more than 2000 peer-reviewed publications, he counts the number of authors from November, 2012 to December, 2013 who explicitly deny global warming (that is, who propose a fundamentally different reason for temperature rise than anthropogenic CO2). The number is exactly one. In addition Powell also has helpful links to the abstracts and main text bodies of the relevant papers. It’s worth noting how many authors agree with the basic fact of global warming – more than nine thousand. And that’s just in a single year. Now I understand as well as anyone else that consensus does not imply truth but I find it odd how there aren’t even a handful of scientists who deny global warming presumably because the global warming mafia threatens to throttle them if they do. It’s not like we are seeing a 70-30% split, or even a 90-10% split. No, the split is more like 99.99-0.01%.
Forecast Calls for an Uptick in Global Warming Disbelief - In more than a decade of reporting on climate change I can say one thing with absolute certainty. When it's cold outside, like during this recent polar vortex in the U.S., people start thinking this whole global warming thing must be overblown. The opposite is also true. Which is why the next summer of El Nino is going to do more for action to combat climate change than any activist or scientific study. Don't believe me? A new social science study in the journal Nature Climate Change backs my anecdotal experience. The report describes the so-called local warming effect. This effect is a result of people tending to rely on, quote "less relevant but available information… in place of more diagnostic but less accessible information." In other words, today's temperature matters a lot more to belief in the problem of global warming than any understanding of how climate change actually works.
Here’s What The New Omnibus Budget Means For Climate And Energy Policy - Earlier this week, lawmakers dropped a $1.1 trillion bill to fund the federal government’s discretionary spending through the rest of fiscal year 2014. For environmental and climate concerns, the omnibus budget brings a variety of changes for both good and ill, starting with funding for the relevant agencies and departments:
- Environmental Protection Agency. The omnibus budget cuts EPA’s budget 1.7 percent, from $8.43 billion in 2013 to $8.2 billion in 2014. Though the final number is actually higher than the $8.15 billion the White House originally requested.
- Department of Energy. Funding for government research into renewable energy and efficiency gets a 4.8 percent boost in the omnibus budget, from $1.95 billion in 2013 to $2.05 billion in 2014. That level is unfortunately lower than what was requested by the White House and proposed by the Senate, but it’s also much higher than the $983 million the House GOP wanted to go with.
- Department of the Interior. Overall, the department’s funding goes up slightly, from $10.46 billion in 2013 to $10.47 billion in 2014.
- National Oceanic and Atmospheric Administration. The various branches of NOAA and its fleet of satellites are especially important when it comes to researching, predicting, and tracking severe weather. Unfortunately, NOAA’s overall budget drops around 3 percent under the omnibus budget, to $5.31 billion in 2014 — once again lower than what the White House and Senate asked for, and more than the House GOP wanted.
- Environmental cleanup and water resources. The omnibus budget also secures $5.8 billion for environmental cleanup efforts — though most of that appears to fall under the umbrella of defense spending — which is a $111 million increase over 2013 levels, according to the Democrats.
Natural Gas Prices, Coal Use, And Carbon Pollution Jumped In 2013 - Emissions of carbon dioxide from energy activities in the United States jumped by 2 percent in 2013 from the year before, according to an early estimate from the Energy Information Administration (EIA). 2013′s emissions estimate is 10 percent lower than emissions levels in 2005, but any number that is not a negative one means that the Obama Administration’s goal of a 17 percent emissions cut from that 2005 level by the end of the decade gets that much harder. The drop in CO2 emissions from 2005 to 2012 was 12 percent, so 10 percent is a step back. The reason that the United States emitted more carbon pollution in 2013 than in 2012 is mostly due to the fact that the electric power sector burned more coal to power American homes and businesses and less natural gas. The coal industry hit a low in April of last year, but has had an uptick since then. Still, regulations like the cross-state air pollution rule and the mercury and air toxic standards rule could lead to the retirement of 60 gigawatts of coal-fired power plants by 2020, so coal’s current rebound could be short-lived. Since burning coal is more carbon-intensive and dirtier than burning natural gas, that would be a good thing for the climate and for people who breathe air. Natural gas, however, has been getting more expensive following extremely low prices in 2012 caused largely by the fracking boom. In 2013, the average wholesale price for natural gas, taken at Henry Hub in Erath, Louisiana, jumped 35 percent to $3.73 million British Thermal Units (MMBtu). This increase reflected large increases in the price of natural gas throughout the United States, focused largely in New England and New York, which were paying $6.90/MMBtu at the end of 2013 due to pipeline constraints and cold-weather demand. But every region in the country saw a substantial price increase from the year before:
Sluggish Economy Prompts Europe to Reconsider Its Intentions on Climate Change - The European Union, which for years has sought to lead the world in addressing climate change, is tempering its ambitions and considering turning mandatory targets for renewable energy into just goals.The union’s policy-making body is also unlikely to restrict exploration for shale gas using the disputed technique known as hydraulic fracturing.A deep and lasting economic slowdown, persistently high prices for renewable energy sources and years of inconclusive international negotiations are giving European officials second thoughts about how aggressively to remake the Continent’s energy-production industries.The details are still being negotiated in Brussels, but officials said the European Commission’s energy and climate proposal will probably include a binding target of reducing emissions by 35 percent to 40 percent by 2030. Some officials wanted to make the new targets for renewable energy nonbinding. But opposition this week appears to have turned the tide in favor of having a binding renewable target — although it would be applied across the European Union rather than to individual nations, according to an official briefed on the negotiations.An intense lobbying effort is underway, with advocates from various groups picking apart aspects of the package.
Global Clean Energy Investment Fell for the Second Year Running - Bloomberg New Energy Finance (BNEF) has released a report stating that despite increasing interest in and awareness of clean energy technologies, for the second year in a row global investment in renewable energy has fallen. Last year it was down to $253 billion, and in Europe it fell by a staggering 41% compared to the year before. This news has come just as investors meet at a United Nations summit aimed to encourage investment in clean energy and build momentum towards the shift to a clean energy economy. It marks the second year of declining investment in the sector, down from the record high of $318 billion in 2011. It has been calculated that in order to make the transition global investment in renewable energy technologies must reach $1 trillion a year by 2030. However the fall in investment, especially in Europe, was partly due to the declining cost of photovoltaic solar panels, and that the number of solar installations around the world actually grew last year by 20%.The largest cause of the fall in investment was due to the fact that big economies such as Germany, France, and Italy, all began to reduce the government support for new alternative energy projects, resulting in Europe’s clean energy investment total to fall from $98 billion to $58 billion. Germany’s spending declined by the most from $26.2 billion in 2012 to $14.1 billion in 2013. Britain only reduced their investment level by a small amount, from $14.3 billion to $13.1 billion.
TEPCO demands families of employees return compensation for evacuation - Tokyo Electric Power Co. (TEPCO), the operator of the tsunami-ravaged Fukushima nuclear plant, is demanding that the families of employees return compensation paid to them for being forced to evacuate from their neighborhoods due to the nuclear disaster, sources close to the case said. In one case, a household is under pressure to return more than 30 million yen in damages from the company, raising concerns about future livelihoods. Critics pointed out that TEPCO's demands are unfair. "The families of employees aren't responsible for the nuclear disaster. As such, the firm's demands for the return of the compensation are inappropriate," one of them says. TEPCO has paid 100,000 yen a month in compensation to each of those who have evacuated from their homes because of the nuclear crisis under the national government's guidelines. Residents of areas designated as a zone where homecoming is difficult in the foreseeable future later became able to demand a lump-sum payment of compensation over a five-year period from June 2012.
S.Korea curbs reliance on nuclear power, but commitment intact (Reuters) - South Korea formally adopted a lower target for nuclear power, but still plans to double its nuclear capacity over the next two decades as its state-run industry builds at least 16 new domestic reactors and pushes for overseas sales. Asia's fourth-largest economy has been under pressure to curb its use of nuclear power in the wake of a scandal over fake safety certificates for parts at some reactors and public unease sparked by Japan's Fukushima disaster. The new energy policy will cut South Korea's reliance on nuclear power to 29 percent of total power supply by 2035, down from a planned 41 percent by 2030. But South Korea remains deeply committed to nuclear energy and the decision was the least stringent reduction of a range of figures suggested last October by a public advisory group. The government last year stressed that nuclear, which made up 26 percent of the power mix at end-2012, will maintain a role and its capacity would not be drastically slashed or expanded in a country already spending billions of dollars on oil, gas and coal imports.
Global warming and energy – intertwined problems in Africa - Much of my work involves the design and installation of clean and robust energy sources in remote parts of the world. On a recent trip to Kenya, my family had the opportunity to tour the Lake Naivasha region in Kenya. This region contains a treasure of wildlife and was a filming location for the movie "Out of Africa." During a boat ride, we witnessed the impacts on climate change – not through academic journal articles or conference presentations – but through people who see climate change with their own eyes. The entirety of Kenya has awakened to the threats of climate change, including the government, agricultural sectors, energy industries and the educational system. My journey to learn more about Kenya's plans brought me to the beautiful and large Kenyatta University campus, just northeast of Nairobi. There, very new and quickly growing programs in mechanical engineering, energy and sustainability, and agricultural engineering are just a few of the programs training tomorrow's technology leaders to make an impact solving today's problems. Among the many initiatives are goals to provide clean, renewable, and robust energy for the campus and the country. Some applications they are focusing on are wind-powered water-pumping systems. The plan is to design, manufacture, install, and service small-scale wind power systems that slowly pump water into elevated storage tanks throughout the day and night. Students, faculty, and staff draw the water is drawn down, typically during morning and evening hours. The prototype wind turbine will be adapted to manufacturing techniques used locally, near the university. It is hoped that wide-scale testing of the wind turbine system will occur over the next three years and thereafter, fast market penetration throughout Africa will be inevitable.
Carbon emissions: coal reliance puts Australia second on OECD's dirt list - Australia is pumping out more carbon emissions to achieve its economic growth than almost any other major economy, while a quarter of its mammal species are threatened with extinction, according to a major new environmental audit.A report by the Organisation for Economic Co-operation and Development (OECD) found Australia was second only to Estonia among 34 advanced nations in terms of greenhouse gas emission intensity per unit of GDP.This measure ranks the ability of economies to grow in an environmentally efficient way, without escalating carbon emissions. Australia’s high ranking is fuelled by its reliance on coal-fired energy.Australia has the highest per capita emissions intensity of any OECD member, the report found, emitting nearly 25 tonnes of carbon dioxide per person in 2010.Australia is also lagging behind other nations when it comes to cutting greenhouse gas emissions over the past two decades, according to the data. Of the 34 nations, only Chile, Mexico, Korea and Turkey have increased their emissions more than Australia since 1990, while the UK, France, Germany and Italy all achieved cuts in that timeframe.
Fish with very high levels of cesium found near Fukushima - A fish contaminated with extremely high levels of radiation was found in waters near the crippled Fukushima No. 1 nuclear power plant, a government-affiliated research institute said. The Fisheries Research Agency said Jan. 10 the black sea bream had 12,400 becquerels per kilogram of radioactive cesium, 124 times the safety standards for foodstuffs. The fish was caught at the mouth of the Niidagawa river in Iwaki, Fukushima Prefecture, on Nov. 17. The site is 37 kilometers south of the stricken power plant. It was one of 37 fish-–all black sea bream--that researchers caught in waters in and off Iwaki in October and November to study the level of radiation to which they were exposed. The research institute said it will study the fish further to try and determine when it became contaminated with such high levels of radioactive cesium. Two other fish also exceeded the safety standards of 100 becquerels per kilogram, at 426 becquerels and 197 becquerels, respectively. The readings of the remaining 34 fish were within the safety limits, according to the Fisheries Research Agency.
Hundreds report symptoms after West Virginia chemical spill: Nearly 800 people in West Virginia have reported symptoms after a chemical spill contaminated the water supply for nine counties, officials said Saturday. By Saturday afternoon, the state's poison control center had logged 787 human exposure calls and 54 animal exposure calls since the massive leak sparked a tap-water ban for 300,000 residents, said the director Dr. Elizabeth Scharman. Many of those were from people experiencing nausea, vomiting, diarrhea, headaches, skin irritation or rashes in “varying degrees of severity," Scharman said. The center — which called in staff from vacation, recruited volunteers and put workers on 16-hour shifts — recommended that only a few callers go to the emergency room because most of the symptoms can be treated at home. ----- The West Virginia American Water Co. announced Thursday that its water supply had become contaminated, after a leak from a Freedom Industries storage tank about a mile upstream on the Elk River sent a strange licorice-like smell wafting through the streets in Charleston, the state capital. West Virginia Gov. Earl Ray Tomblin declared a state of emergency in Boone, Cabell, Clay, Jackson, Kanawha, Lincoln, Logan, Putnam and Roane counties after the spill of up to 5,000 gallons into the Elk River. "If you live in one of these areas, do not use tap water for drinking, cooking, cleaning, washing, or bathing. At this time, I do not know how long this will last,"
Tap water may be out for days after W.Va. spill - Tap water in nine West Virginia counties continues to be off-limits, the governor said Saturday evening, as residents spent a third day unable to drink from the faucet or bathe following a chemical spill. “We will let you know as soon as the water company lifts the ban,” Gov. Earl Ray Tomblin said at a news conference. “Please remain patient and keep checking on your neighbors.” Tomblin said officials will continue testing the water supply and purging the system, after nearly 800 people reported symptoms by Saturday afternoon. The National Guard said tests administered on the water on Saturday showed the contamination level was decreasing but that the water was not yet safe to use, reported NBC affiliate WSAZ. “I would expect that we are talking days” before the water is safe, said West Virginia American Water's president, Jeff McIntyre.
West Virginia residents cope, with days of water woes still ahead after chemical spill - —“DO NOT USE WATER,” say the signs taped over sinks at the airport, and in the State Capitol the sinks are entirely wrapped in plastic bags. People line up for free water at the fire stations or buy it at the Dollar General — $1.60 for a 20-ounce Dasani, $39 for a flat of 24 bottles. A chemical used in coal processing has leaked from an old tank along the Elk and invaded the water supply, a crisis that has affected nearly 300,000 people in nine counties and effectively closed the largest city in the state. You can’t drink the water, bathe in it or do laundry with it. It’s good only for flushing. Monday will mark the fifth day of the water emergency, which began early Thursday when people all over town registered a powerful odor like black licorice. Two state employees tracked the leak to Freedom Industries, which owns a row of vintage storage tanks along the south bank of the Elk. The chemical had leaked from an inch-wide hole in the bottom of one tank, pooled in a containment area and then seeped through a porous cinder-block retaining wall, down the bank and into the river. Government officials said Sunday that chemical levels had dropped significantly over the weekend, enabling the West Virginia American Water Co. to begin flushing out the contaminated pipes. The entire process will take a number of days and will occur in stages, starting in Charleston and working outward to the remote areas of the distribution system. The infrastructure here was primed for a water crisis. The intake for the system is downstream by a little more than a mile, and on the same side of the river, as the tanks containing the chemicals.
The Wait Continues for Safe Tap Water in West Virginia - As hundreds of thousands of residents faced a third day without water because of a chemical spill in a local river, a water company executive said on Saturday that it could be days before it was safe for them to drink tap water again. Jeff McIntyre, president of West Virginia American Water, said that officials had set up four labs to test the amount of chemical in the water, but that it might take days to provide enough samples to determine whether the water was safe. A state official also said that thousands of gallons more of the chemical had leaked into the river than was initially believed. A team from the Chemical Safety Board, an independent federal agency that investigates industrial chemical accidents, will arrive on Monday to begin looking into the spill, the board said on Saturday. “Our goal is to find out what happened to allow a leak of such magnitude to occur and to ensure that the proper safeguards are in place to prevent a similar incident from occurring,” At a news conference here on Saturday evening, officials said tests had begun to show concentrations of the chemical dropping below the one part per million threshold considered safe by the Centers for Disease Control and Prevention. The concentration must remain that low for 24 hours before the water system can be flushed out and the do-not-use ban can be lifted. Officials said they planned to conduct at least 100 additional tests of samples overnight and on Sunday.
Chemical Leak Into West Virginia River Far Larger Than Previously Estimated - As over 300,000 people in West Virginia face a fourth day without water, state environmental officials are now estimating that as much as 7,500 gallons of a chemical used to process coal — Crude MGHM — may have spilled into the Elk River. That number is a substantial increase from early estimates of 2,000 to 5,000 gallons. The chemical leak, first reported Thursday, was at a facility owned by Freedom Industries along the Elk River, just 1.5 miles upstream from a major intake used by the largest water utility in the state, West Virginia American Water. At a press conference Saturday afternoon, Jeff McIntyre, president of West Virginia American Water Company, said that it would likely still be “several days” before tap water in the nine counties affected would be safe for anything besides flushing toilets. The U.S. Center for Disease Control and Prevention has set the standard of 1 part per million as a safe concentration of Crude MGHM in drinking water. Levels of the chemical must remain below this threshold for over 24 hours of testing before the water company can begin flushing the system. At a press briefing Saturday evening, Gov. Earl Ray Tomblin’s (D) office released the first results of the now round-the-clock water sampling efforts. While some tests are coming in below the safe threshold, the system is still far from clean. Eight out of 18 recent test results tested above 1 part per million. Some of the earliest tests showed concentrations as high as 3 parts per million.
Koch Brothers' Georgia-Pacific Supplied Coal Chemical Contaminating West Virginia River - A few days after the Freedom Industries' spill of 4-methylcyclohexane methanol into the Elk River near Charleston, West Virginia, little is known about how that chemical impacts drinking water. Leaving the tap water of 300,000 citizens across nine counties off-limits, it will still be at least several days until the water is safe to drink, and possibly much longer. A DeSmogBlog investigation reveals that Georgia-Pacific, a Koch Industries subsidiary, served as the supplier of the chemical concoction, while Freedom Industries serves as the storage facility and product distributor. "With coal in short supply worldwide, obtaining maximum quality and yield from coal preparation plants is vital to feeding high global demand and capitalizing on higher coal prices," explains an April 2008 press release. "With this in mind, Georgia-Pacific Chemicals LLC is unveiling its new patent-pending Talon(TM) Mining Reagents product line in conjunction with its distributor, Freedom Industries."
Freedom Industries executive a two-time convicted felon, benefited from 2009 federal stimulus - Freedom Industries, the company [eco-terrorists] responsible for contaminating the water of 300,000 Kanawha Valley residents, was founded by a two-time convicted felon, benefited from the 2009 federal stimulus and at least two of its executives have longstanding ties to the Charleston business community. Since the chemical spill on Thursday, Freedom Industries executives have entirely avoided media requests, except for a brief news conference Friday night... In 2008, Freedom Industries secured a contract to distribute a line of products called Talon that are used as a binder in coal processing, according to a news release issued at the time. Talon is made by Georgia-Pacific Chemicals LLC. Georgia-Pacific is owned by the billionaire industrialists Charles and David Koch.
West Virginia’s Water Catastrophe Reveals Gaping Holes In Government Oversight - After a major chemical spill contaminated the water supply and as 300,000 West Virginians endure their fifth day without clean tap water for drinking, bathing, or cooking, many residents are left asking the same question: How could this happen?On Thursday, up to 7,500 gallons of crude MCHM, a chemical used in the coal production process, leaked from a storage facility operated by Freedom Industries into the Elk River and the drinking water supply for 16 percent of the state’s population. The fact that a potentially toxic chemical could be stored on the banks of a river — just over a mile upstream from a major water treatment facility that distributes drinking water to a 1,500 mile area — without adequate testing, inspection, or reporting points to several levels of failure.“The fundamental issue here is the governor and the DEP [Department of Environmental Protection] have created an atmosphere of permissiveness related to coal and gas operations,” said Evan Hansen, president of Downstream Strategies located in Morgantown, West Virginia. “It seems like their intention is to make permitting as cheap and easy and painless as possible and this is what was going to happen eventually.” State officials have said Freedom Industries potentially fell into one or more ‘loopholes’ because the chemical was not classified as a hazardous material, the Charleston Daily Mail reported. Thus, they may not have been required to “follow a state law requiring industrial facilities to report an emergency within 15 minutes.”
West Virginia puzzled, outraged over chemical leak - latimes.com: Few people in West Virginia had any idea that an obscure company was storing a mysterious coal-washing chemical in tanks overlooking the Elk River, just upstream from a major water treatment plant. Nor did many realize that no agency had conducted regular inspections of those tanks, even though they are perched on a steep bank that tumbles down to the river northeast of downtown Charleston. On the morning of Jan. 9, residents complained about a licorice-like odor wafting from the site, operated by a chemical company with the unlikely name of Freedom Industries. When state inspectors arrived to investigate, they discovered that one of the tanks had ruptured and dumped the little-known chemical 4-methylcyclohexane methanol, known as MCHM, into the river. The inspectors also discovered something else: Freedom Industries had not taken action to stop the leak or report it to authorities, according to the state Department of Environmental Protection. As it turned out, there are virtually no regulations governing inspection and maintenance of the storage tanks. "I can't believe there is not a law against what they did," Charleston's outspoken mayor, Danny Jones, said in an interview. He called the chemical company "a bunch of renegades who have done irreparable harm to this valley." "Quite frankly," he said, "somebody needs to go to jail."
Water Ban Lifted for Part of West Virginia After Spill - By Monday evening, officials had given the green light to about 15 percent of West Virginia American Water's customers, and company spokeswoman Laura Jordan said as much as 25 percent of its customer base could have water by the end of the day. The water crisis shuttered schools, restaurants and day-care centers and truckloads of water had to be brought in from out of state. People were told to use the water only to flush their toilets. Officials were lifting the ban in a strict, methodical manner to help ensure the water system was not overwhelmed by excessive demand, which could cause more water quality and service problems. An online map detailing what areas were cleared showed a very small portion in blue and a vast area across nine counties still in the 'do not use' red. Customers were credited with 1,000 gallons of water, which was likely more than enough to flush out a system. The average residential customer uses about 3,300 gallons per month
Water-relief tankers filled from Charleston water system - West Virginia American Water pulled its bulk water tankers out of service in Kanawha County Thursday evening, after complaints that the water being distributed to residents had the same odor as the chemical-tainted water from last week's Freedom Industries spill into the Elk River. Kanawha County Manager Jennifer Sayre said complaints began coming in late Thursday afternoon about the now-familiar licorice odor in water given out at the Crossings Mall in Elkview and at Riverside High School."We were getting conflicting information as to where [those tankers] were filled," Sayre said Thursday evening. "We wanted to clear that up."According to Sayre, county officials originally were told the tankers were being filled "off site, out of Charleston." After hearing complaints, though, they checked again with West Virginia American Water officials, who told them to take the tankers out of circulation, Sayre said. Water company spokeswoman Laura Jordan said the tankers had been filled near the plant after zero levels of the chemical "Crude MCHM" were recorded. "But to avoid any concerns," she said, "just to reassure our customers, we're filling up the tankers from another system."
Freedom Industries’ Other Chemical Storage Site Is Unsafe Too - After 7,500 gallons of a chemical called crude MCHM spilled into West Virginia waters on Thursday, contaminating potable water for 16 percent of the state, the company responsible was ordered to move the rest of those chemicals to a new site. But that site is not safe either, according to a report released Wednesday by the state Department of Environmental Protection (DEP). Freedom Industries has now been slapped with five violations from the DEP for using a storage facility without secondary containment — meaning there was no adequate barrier to prevent a chemical from leaving a site if it spilled from the original container. “The plan indicates that the building itself acts as secondary containment, but holes exist at floor level in the building’s walls,” DEP inspector Kevin Saunders wrote in the report. “A variety of chemicals (emulsifiers, oxidizers, acids, corrosives, mineral oil, etc) were stored in the facility without secondary containment and could reach the trench in the event of a spill.” What’s more, the new site Freedom Industries chose to store the crude MCHM was — like the first site — within 1,000 feet of a river that supplies potable water, the DEP report said. According to the report, the new location to store the remaining crude MCHM is a building, which is surrounded by a trench. The trench is supposed to catch any runoff from the building, which Freedom Industries reportedly indicated may act as secondary containment. However, Saunders wrote that there is no way to keep leaked chemicals from mixing with stormwater, so the trench does not act as secondary containment.
48 Hours After West Virginia Told Residents It Was Safe To Start Using Water, Pregnant Women Warned Not To Drink -- More than two days after West Virginia American Water began lifting the ban on water use that had impacted 300,000 West Virginians, the Centers for Disease Control and Prevention (CDC) finally broke its silence and advised pregnant women not to drink the water. Late Wednesday, the West Virginia Department of Health and Human Resources issued a one-page advisory for pregnant women, based on guidance from the CDC, recommending “out of an abundance of caution” that “pregnant women drink bottled water until there are no longer detectable levels of MCHM in the water distribution system.” Previously, officials had maintained that levels of the chemical, crude MCHM, below 1 part per million were considered safe. As of Thursday, officials had cleared the water for more than 200,000 West Virginians based on the 1 part per million threshold set by the CDC. As the Charleston Gazette reported the latest warning to pregnant women comes after the CDC repeatedly refused the paper’s requests for information regarding how the 1 part per million figure was derived. According to the CDC’s letter, “since making the initial [1 ppm] calculations, scientists have obtained additional animal studies about MCHM. These are being reviewed.” Very little is known about the chemical, crude MCHM, and its potential effects on humans. Used in the coal production process, MCHM is one of 64,000 chemicals in use in the U.S. that were grandfathered in to the 1976 Toxic Substances Control Act (TSCA), meaning there are no requirements that anyone prove whether or not they are safe.
Company Behind West Virginia’s Chemical Spill Files For Bankruptcy - According to the Charleston Gazette, Freedom Industries filed for Chapter 11 bankruptcy today. On January 10, a tank owned by Freedom spilled 7,500 gallons of 4-Methylcyclohexane Methanol (MCHM) — a chemical used to wash coal of its impurities — into West Virginia’s Elk River. As a result, over 300,000 people in the state were left without drinking water for almost five days, and numerous reports of illnesses possibly related to the spill are already filtering in. Freedom’s filing lists $1 to $10 million in assets, $1 to $10 million in liabilities, and 200 to 999 creditors. As of Thursday, at least 20 lawsuits had been filed against Freedom Industries over the leak. The company reportedly lacks an umbrella insurance policy, and what coverage it does have is “inadequate to cover the amount of claims in this case.” “Under the bankruptcy code,” the Gazette reports, “Chapter 11 permits a company to reorganize and continue operating.” Chapter 11 also requires all creditors to stop all collection attempts.
Why Workers in Red States Vote Against Their Self-Interest - Robert Reich - Last week’s massive spill of the toxic chemical MCHM into West Virginia’s Elk River illustrates another benefit to the business class of high unemployment, economic insecurity, and a safety-net shot through with holes. Not only are employees eager to accept whatever job they can get. They are also also unwilling to demand healthy and safe environments. The spill was the region’s third major chemical accident in five years, coming after two investigations by the federal Chemical Safety Board in the Kanawha Valley, also known as “Chemical Valley,”. No action was ever taken. State and local officials turned a deaf ear. The storage tank that leaked, owned by Freedom Industries, hadn’t been inspected for decades. But nobody complained. Not even now, with the toxins moving down river toward Cincinnati, can the residents of Charleston and the surrounding area be sure their drinking water is safe — partly because the government’s calculation for safe levels is based on a single study by the manufacturer of the toxic chemical, which was never published, and partly because the West Virginia American Water Company, which supplies the drinking water, is a for-profit corporation that may not want to highlight any lingering danger. So why wasn’t more done to prevent this, and why isn’t there more of any outcry even now? The answer isn’t hard to find. As Maya Nye, president of People Concerned About Chemical Safety, a citizen’s group formed after a 2008 explosion and fire killed workers at West Virginia’s Bayer CropScience plant in the state, explained to the New York Times: “We are so desperate for jobs in West Virginia we don’t want to do anything that pushes industry out.” Exactly.
Coal Country Toxic Chemical Spills: Not If, But When -- Much has been made of the nation’s deteriorating highways and bridges, but the infrastructure crisis plaguing the mining and related chemical industry at times has reached nightmarish proportions. The worst example dates back to February 26, 1972, when three dams containing a witches’ brew of coal slurry and water in Logan County, W.Va., failed in rapid succession. A startling 125 people were killed, 1,121 others were injured, 17 communities were wiped out and over 4,000 were left homeless after 130 million gallons of sludge and toxic water were released into the Buffalo Creek flood plain. Despite evidence of negligence, the Pittston Coal Company -- the owner of the dams -- called the tragedy an “act of God.” But state investigators concluded the company had shown a “callous indifference” to public safety,” and had ignored years of warnings from area residents.In October 2000, about 300 million gallons of fine coal refuse and water escaped from a 68-acre impounding area owned by Martin County Coal Corporation in eastern Kentucky. The deluge of coal sludge – larger in quantity than the Exxon Valdez oil spill -- flooded nearby mines, damaged thousands of homes and killed all aquatic life along 200 miles of stream, all the way to the Ohio River. Then in 2002, a 900-foot high, 2,000-foot long valley fill near a mountain-top coal production site in Lyburn, W.Va., failed and slid into a sediment pond at the toe of the fill. The accident generated a tidal wave of toxic water and sediment that destroyed nearby homes and cars.
Does West Virginia Have The Political Will To Prevent The Next Water Disaster? - On Monday, West Virginia officials began lifting the water bans that had affected nine of the state’s counties since Thursday, when as much as 7,500 gallons of a chemical used to clean coal spilled into the Elk River. Residents in the affected regions celebrated when they heard the news, which brought a welcome end to brushing teeth with bottled water and trekking to friend’s houses and community centers to shower. But for some West Virginia residents, the ban’s end presents a new fear: that rather than use the spill to fight for tougher environmental regulations, the lawmakers, residents, and rest of the country will soon forget that the spill ever happened. “It’ll be the same song and dance again,” Charleston . “Because it’s the same song and dance that happens every time. It’s always ‘We can’t afford it; we can’t tax the industry more than they’re already taxed, they’re already over-regulated.’” McGervey’s lack of optimism is not unfounded. Three years ago, the U.S. Chemical Safety Board urged the state to adopt stricter chemical oversight rules after an explosion at a Bayer CropSciences plant killed two workers. Their recommendation is still on the books, having never made it past proposal stage.
Complaints Mount Against Fracking Pollution - Last year saw hundreds of complaints mounted against well-water contamination from oil or gas drilling in US, but the jury is still out as to whether hydraulic fracturing is to blame, news agencies report.Complaints in Pennsylvania, Ohio, West Virginia and Texas—key venues of the US oil and gas boom—continue to suggest that drinking water is being contaminated by oil and gas operations, which has been confirmed in a number of cases, but not across the board. According to complaint data examined by the Associated Press, there were 2,000 complaints registered last year, with 62 of those alleging possibly well-water contamination from oil and gas activity. For the same time period, Pennsylvania received 398 complaints alleging that oil or natural gas drilling polluted or otherwise affected private water wells. More than 80,000 wells have been drilled or permitted in 17 US states since 2005, with oil and gas companies using between 2 million and 9 million gallons of water mixed with sand and chemicals to frack a single well.According to some reports, the drilling industry has used 250 billion gallons of fresh water since 2005. Much of that returns to the surface along with naturally occurring radium and bromides, and concerns are growing about the effects this is having on the environment.
Duke Fracking Tests Reveal Dangers Driller’s Data Missed - When the U.S. Environmental Protection Agency declared that a group of Texashomes near a gas-drilling operation didn’t have dangerous levels of methane in their water, it relied on tests conducted by the driller itself. Now, independent tests from Duke University researchers have found combustible levels of methane in some of the wells, and homeowners want the EPA to re-open the case. The previously undisclosed Duke testing illustrate the complaints of critics who say the agency is reluctant to sanction a booming industry that has pushed down energy prices for consumers, created thousands of jobs and buoyed the economy. “I don’t understand why they would let the company that was accused of doing the wrongdoing conduct the tests,” said Shelly Perdue, who lives near the two wells in Weatherford, 60 miles (97 kilometers) west of Dallas. “It doesn’t make sense.”The driller, Range Resources Corp. (RRC), denies that its drilling in the area is the source of any contamination and says its testing was conducted by an independent laboratory. “Range used state and federally approved testing methodologies that are internationally recognized and those results have found historically consistent water quality,” Matt Pitzarella, a spokesman for the Fort Worth, Texas-based company, said in an e-mail. “Range’s operations did not cause or contribute to the long-standing and well-documented matter of naturally occurring methane.”
Illinois Residents Demand a Ban on Fracking - An Illinois ban on fracking is inevitable. The question is whether it will happen before or after a major fracking disaster. The public comment period on Illinois’ draft regulations ended Jan. 3 with groups in potentially impacted areas repeating their call for a ban on fracking. A group of southern Illinois residents representing several grassroots groups drove to Illinois Department of Natural Resources (DNR) headquarters in Springfield to join with Frack Free Illinois in delivering comments on the regulation and a petition asking Gov. Quinn to oversee a rewrite. “These inadequate rules will leave nothing but legacies of disasters to those who voted on this irresponsible law and abandon Illinois tax payers who will indeed foot the bill for public health issues like cancer and leukemia.” The regulation will likely be improved before being presented to the General Assembly’s Joint Committee on Administrative Rules for final approval. Even groups who supported the law are objecting to the DNRs’ flaccid follow up. A few politicians will claim a victory for the environment after DNR makes marginal changes. But, the real weakness in the rules follows from the inadequacy of the law itself. The law does not address the consequences of a tornado hitting a fracking site. It does not resolve the release of chemicals in a major flood, despite the fact that fracking will likely happen in floodplains of a region bordered by two of the highest volume rivers in America. The law provides for monitoring, but not preventing, fracking induced earthquakes despite the fact that fracking is expected along major fault lines. If a large groundwater source, such as the Mahomet aquifer, is depleted or contaminated it could impact the water supply of hundreds of thousands of people..When pushing for the law, Gov. Quinn claimed it will protect the environment. That was a lie.
Fracking Chemicals In North Carolina Will Remain Secret, Industry-Funded Commission Rules - What, exactly, are those chemicals being pumped underground during the fracking process? In North Carolina, no one has to say. On Tuesday, the 15-member state Mining and Energy Commission voted unanimously to pass a rule that would let fracking companies keep secret the makeup of the chemical mixture they pump underground to aid shale gas drilling. From the North Carolina News Observer: The public safety standard will help the energy companies protect their secret sauce used in natural gas drilling, but critics said it would also keep residents in the dark about potent chemicals used near local farms and waterways. The rule passed unanimously after nearly three hours of intense debate Tuesday, and it follows more than a year of deliberations that had the commissioners tied up in knots. Commissioners sought to appease frightened residents, the energy industry and lawmakers eager to promote drilling for economic development. Though the rule passed Tuesday is only a recommendation to the state legislature, which will reportedly have the final gavel over fracking disclosure standards in the future, it effectively protects energy exploration companies from disclosing their chemical concoctions until then, according to the News Observer.
Are Fracking Fluids to Blame for Rail Car Explosions? - Over the past year or so there seems to have been far more train derailments of cars carrying crude oil that have resulted in huge, deadly explosions, and it is not a coincidence that the oil in these explosions originated from the Bakken shale formation in North Dakota. One problem is that the light crude extracted from the Bakken is more flammable than heavy crude, but there are other factors at play here as well. In order to extract oil in the Bakken the oil companies use fracking to split apart the shale rock and gain access to the tight light oil trapped there. A special mix of chemicals is used to split the rocks underground, and while companies refuse to disclose the exact composition of this cocktail of chemicals, claiming that it is a trade secret, there is a high possibility that they are extremely flammable. Some of these chemicals remain mixed up in the crude oil, thereby increasing its flammability. Recently the Wall Street Journal has also looked into the increase in explosions of rail tankers carrying fracked crude oil. They suggested three possibilities for the explosions: irresponsible care during the transport of the crude; other, more flammable products such as propane naturally mixed into the crude; or the addition of flammable chemicals during the fracking process. Back in August Bloomberg identified another problem caused by the fracking chemicals, which is much of the millions of gallons of chemicals injected into the ground during fracking is in the form of hydrochloric acid. This is a highly corrosive substance and the railway administration has begun to note an increasing number of tanker cars are suffering damage to their interior surfaces after transporting light crude, likely due to the presence of the acid, and that this is weakening the tanks and making them more prone to rupture.
Offshore Fracking (And Dumping Chemicals Into Coastal Waters) Beyond The Public Eye - The U.S. Environmental Protection Agency published a rule on January 9, 2014 requiring oil and gas companies using hydraulic fracturing off the coast of California to disclose the chemicals they discharge into the ocean. Oil and gas companies have been fracking offshore California for perhaps as long as two decades, but they largely flew under the radar until recently. An Associated Press story in August 2013 revealed that oil and gas companies had engaged in hydraulic fracturing at least a dozen times in the Santa Barbara Channel – the site of the nation’s first offshore drilling site as well as the first major oil spill. Documents published through a Freedom of Information Act request showed that federal regulators have allowed drillers to dump chemicals into the ocean without an environmental impact statement assessing the effects of doing so. This was largely unknown to California regulators and the general public. The Bureau of Safety and Environmental Enforcement – the federal agency responsible for regulating offshore oil drilling – has issued “categorical exclusions” for fracking offshore California, essentially giving frack jobs a pass on environmental assessments. The logic is that offshore fracking has largely occurred in existing wells, locations for which companies already jumped through all the environmental hoops long ago. Offshore fracking could be much more widespread than even federal regulators are aware. According to the Environmental Defense Center, BSEE only began to learn about the extent to which fracking was occurring offshore when pressed to respond to FOIA requests.
France Oil Giant Is Expected to Seek Shale Gas in Britain — The French oil giant Total is on the verge of becoming the first major oil company to explore for natural gas and oil in shale rock in Britain. Under the deal, which may be announced as soon as Monday, Total would commit about $50 million for a roughly 40 percent stake in licenses held by a group of companies in Lincolnshire in the East Midlands, according to three people familiar with the matter who spoke on condition of anonymity because the agreement has not yet been signed. Total’s participation would be a vote of confidence in the government of Prime Minister David Cameron, which has been trying to promote shale gas as an alternative to declining production of oil and gas in the North Sea, despite opposition from local communities and environmental groups. Total, a major offshore oil and gas producer in Britain, apparently wants to expand its role. Surging production of oil and gas from shale rock has sharply lowered energy prices in the United States and helped make its industry more competitive, though it has also brought criticism from environmental advocates. Britain, however, is the lone country in Western Europe that has encouraged the exploration of shale gas, which is produced through hydraulic fracturing, or fracking, which uses a high-pressure mix of water, sand and chemicals. Analysts say that if shale gas production is successful in Britain, countries like France and Germany, which are thought to have considerable shale gas potential, might reassess their thinking.
Fracking in the UK: 'We're going all out for shale,' admits Cameron - David Cameron is to declarethat his government is "going all out for shale" as he announces that councils will be entitled to keep 100% of business rates raised from fracking sites in a deal expected to generate millions of pounds for local authorities. In a renewed attempt to win support for the controversial expansion of fracking, the prime minister will also say that revenues generated by shale gas companies could be paid directly in cash to homeowners living nearby.The prime minister's announcement, likened to a bribe by environmentalists, comes on the day that the French energy group Total becomes the first global oil company to invest in a shale gas exploration project in Britain. The prime minister will make a new pitch to shore up support for fracking amid concerns about the use of high-pressure water and chemicals to fracture underground rock, thereby releasing trapped gas. New fracking sites have opened up in the Midlands, Cumbria and Wales. Cameron, who is to visit a fracking site, will announce that the government is to double from 50% to 100% the amount that councils in England can keep in business rates raised from shale gas sites. The offer, which was proposed last year by the Institute of Directors, could be worth up to £1.7m a year for a typical site.The prime minister will also try to reach out to concerned local communities by saying that the industry will consult on how to distribute funds of up to £5m-£10m for a typical site over its lifetime – a lump sum of £100,000 when a test well is fracked, plus 1% of revenues. Direct cash payments could be made to homeowners living near fracking sites.
Are Towns In England Being Bribed To Accept Fracking? - Speaking in front of a fracking facility in Lincolnshire, England, British Prime Minister David Cameron announced new financial incentives for communities that embrace unconventional natural gas extraction. Under the new rules, local councils will be allowed to keep 100 percent of the taxes levied on fracking projects in their area instead of the 50 percent previously allowed. That could mean as much as £1.7 million for local coffers for a typical 12-well site. Communities would also receive an additional £100,000 when a test well is fracked and would earn one percent of the company’s revenues over the lifetime of the wells.“Shale is important for our country. It could bring 74,000 jobs, over 3 billion pounds of investment, give us cheaper energy for the future and increase our energy security,” said Cameron. “I want us to get on board this change that is doing so much good and bringing so much benefit to North America. I want us to benefit from it here as well.”“This move raises potentially serious concerns about conflicts of interest, if councils that benefit from this money are also the ones who decide on planning applications from fracking firms in the first place,” Jane Thomas of Friends of the Earth told the Guardian.
U.S. Will Be Energy Self-Sufficient by 2035 on Shale, BP Says - The U.S. will be able to provide for all its own energy needs by 2035 as output of shale oil and gas accelerates and demand growth slows, BP said. The country, which became the world’s biggest producer of liquid energy last year, will produce more gas and coal than it consumes, BP said in its Energy Outlook 2035 report today. The report highlights how technology to exploit shale resources by grinding underground rocks to release oil and gas will transform the global energy trade over the next two decades. Asia and Europe will become the main importers of fuel while the rest of the world exports, and the Organization of Petroleum Exporting Countries will have to rein in output to prevent prices from falling. “Both oil and gas import concentration will increase massively in Asia and Europe,” “About 80 percent of all traded oil will go into Asia.” World energy demand will rise by 41 percent by 2035 from 2012, a slower pace than the 52 percent gain in the last two decades, BP said in the report. Ninety-five percent of demand growth will come from emerging economies, defined as those not in the Organisation for Economic Cooperation and Development, and more than half the increase will come from China and India. Spare production capacity from OPEC is forecast to surge to 6 million barrels a day by about 2018 as the group cuts output to offset rising global supplies, Ruehl said. That’s the highest since the 1980s. The group’s unused capacity was at 3.37 million barrels a day in November, according to the International Energy Agency.
BP appeal against ‘fictitious’ Gulf spill compensation claims fails - An attempt by BP to block billions of dollars of what it says are bogus compensation claims related to the Deepwater Horizon Gulf oil spill has been rejected by a US appeals court. The company was seeking to overturn judicial approval of settlement it agreed in 2012 after it said a legal loophole allowed thousands of businesses that were not affected by the disaster to claim “money they don’t deserve”. But on Friday night an appeals panel rejected BP’s case, finding it had not explained how the courts could check the existence of claimants that did no lose money because of the spill. Two out of three judges on the panel found against BP and said the company should be able to defend itself against bogus claims. In its appeal filing last year, BP referred to a compensation payment of $21m to a rice mill located 40 miles from the Louisiana coast as an example of the unharmed businesses that were profiting from the disaster and the loophole in the settlement agreement. The ruling on Friday said: “No case cited by BP… suggests that a district court must also safeguard the interests of the defendant, which in most settlements can protect its own interests at the negotiating table.”
Oil Company Cries ‘Sabotage’ After 11 Mystery Spills Coat Trinidad Beaches In Crude The media is calling it one of Trinidad and Tobago’s worst environmental disasters ever.The company responsible is calling it sabotage.Petrotrin, Trinidad’s state-owned oil company, is accusing an unknown party of causing at least two out of the 11 recent oil spills that occurred from a pipeline in mid-December, cloaking miles of beaches with crude. At least 7,000 barrels of oil have spilled so far, and local officials have reportedly accused Petrotrin of trying to downplay the extent and size of the spill. Company chairman Lindsay Gillette told reporters earlier this month that there was “strong evidence” to show that its facilities were “deliberately tampered with.” At one of the facilities, run by Trinity Exploration Production, Gillette said “two of the plugs were removed and you would [need] a very large wrench to remove that plug physically for that oil to flow”Trinity has told local media that the spills were not its fault. “The evidence is out there but I don’t think it’s being articulated clearly,” Trinity executive chairman Bruce Dingwall said. Now, the region’s Minister of Energy is being urged to commission an independent investigation into what caused the spill, how it has effected the area, and what needs to be done next.
Canada loses patience on Keystone XL, tells U.S. to decide (Reuters) - Canada bluntly told the United States on Thursday to settle the fate of TransCanada Corp's proposed Keystone XL pipeline, saying the drawn-out process on whether to approve the northern leg of the project was taking too long. The hard-line comments by Foreign Minister John Baird were the clearest sign yet that Canada's Conservative government has lost patience over what it sees as U.S. foot-dragging. Baird also conceded that Washington might veto the project, the first admission of its kind by a Canadian government minister. The 1,200-mile (1,930-km) pipeline would carry 830,000 barrels a day from the Alberta tar sands in western Canada to the U.S. Gulf Coast. Ottawa strongly backs Keystone XL, which it says would create jobs and provide a secure supply of oil to Canada's closest ally and trading partner. "The time for Keystone is now. I'll go further - the time for a decision on Keystone is now, even if it's not the right one. We can't continue in this state of limbo," Baird said in a speech to the U.S. Chamber of Commerce. Although the State Department is responsible for ruling whether the pipeline meets the national interest, President Barack Obama has made clear he will make the final decision. Obama is under heavy pressure from environmental activists to veto the northern leg, and Washington seems in no hurry, despite the growing irritation in Ottawa. Canada is the largest single supplier of energy to the United States.
A "Fair Price" for Canada's Oil Is a Slippery Slope - It's a phrase that has wafted up from the oil sands to the airwaves. A "fair price" for Canadian oil. The key to this, we are told, is pipeline access to "tidewater" The basic argument goes like this: A barrel of oil sands crude currently trades at a lower price than other global oil benchmarks. That price gap means Canadians are losing money on every barrel sold. Access to world markets will fetch higher prices, elevating our collective prosperity. It's a persuasive story, tickling the part of the brain associated with loss aversion. No one wants to bleed money day after day. At the same time it paints a picture of one nation, our fortunes rising and falling in unity. It's good politics. But the reality is more complex. As individuals and businesses calculate whether the risks of these pipelines outweigh the rewards, three broad trends should be kept in mind. First, what kinds of energy do those global markets want? Second, who can get it there at the lowest price? And most importantly, who wins and who loses if the price of Canadian oil climbs? The answers point to 2014 as a crucial year in the pipeline battle. That's because the window in which these projects are viable may be closing faster than we think.
America Needs More Oil Pipelines - After Tuesday’s train derailment in Plaster Rock, New Brunswick, causing spills of crude oil and propane, it is time to reconsider the approval of a new generation of pipelines in America.Although the U.S. has over 2.5 million miles of pipelines, government authorities still insist on blocking additional pipeline construction. Approval of permits is slow. President Obama has yet to approve TransCanada’s Keystone XL pipeline, which would bring oil from Canada to U.S. refineries near the Gulf of Mexico.Last year saw a series of rail accidents involving crude oil. For example, in March, trains derailed in Minnesota, spilling 30,000 gallons, in June, it was Calgary’s turn and in November, a train carrying 2.7 million gallons derailed in Alabama.The Plaster Rock accident appeared to be linked to a problem with the emergency brake, which went on suddenly after the air brake failed. A July rail accident in Lac-Mégantic, Quebec, in which 47 people were killed, was also caused by a brake failure, causing the train to roll backwards into the town and explode.No deaths or injuries occurred in the village of Plaster Rock, but 150 residents were evacuated. The oil originated from western Canada, and it was on its way to a refinery in Saint John, New Brunswick. North America is producing 18 million barrels of oil a day (11 million from the United States) and data show that pipelines are safer than road and rail. With a growth of over 3 million barrels per day in Canadian and U.S. oil production since 2008, lack of infrastructure is a serious consideration.
Oilprice Intelligence Report: US Oil Exports: What Goes Unnoticed - As the US oil industry gains momentum with its lobbying efforts to lift the ban on crude exports in place since the 1970s, what has gone largely unnoticed is that US exports of refined oil products, which are not banned, have been steadily rising thanks to the shale boom and a reduction in US consumption of oil products. The overall result, according to a “Charticle” by RealClearEnergy, is a “precipitous decline in oil imports, to the point where they now barely surpass domestic production.” US oil exports have cut the gap to 5.7 million barrels per day, with exports largely of refined petroleum products rising since 1992 from 1 million bbd to 3.5 million bbd. These numbers will be skewed if the Keystone XL pipeline is approved because imports will spike from the transit of Canadian crude across US borders to Gulf Coast refineries—but at the same time, much of this refined product could then be exported. This is all without lifting the ban on crude exports, which was imposed after the Arab oil embargo of the 1970s.
Lifting the Oil Export Ban: Where the Refiners Stand - As the debate over whether to lift the US ban on crude oil exports intensifies, producers will clearly benefit, but the situation for refiners is more complicated, but most are lining up on the side of big oil and free trade. For the producing majors, lifting the export ban is a clear win because all that increased crude production at home has reduced prices, while at the same time new horizontal drilling methods are much more expensive than the conventional. But for refiners, who are enjoying the cheap domestic prices for crude, the math is not that simple. While supermajor oil companies like Exxon Mobil and ConocoPhillips are keen to see the US ban on oil exports lifted, at least one big US refiner, Valero Energy, which has profited from the ban, is speaking out against the gaining momentum behind the idea. Valero Energy buys cheap oil in the US and sells gasoline and diesel to Europe, Latin America and West Africa. Valero is fearful that its profits would take a hit because lifting the crude export ban would potentially raise oil prices at home and in turn push prices up at the gas pump, leading to refinery closures that have only just recouped from earlier high oil import prices. But not all refiners agree with Valero—on principle. Phillips says exports of crude oil and other products are good for the US and contribute to a strong balance of trade, and Marathon Petroleum (MPC) says it supports free markets. Tesoro Corp. has also lined up for exports.
Energy is gradually decoupling from economic growth -- According to BP’s Energy Outlook, which was released this week, global energy demand will continue to grow until 2013, but that growth is set to slow, driven by emerging economies — mainly China and India. To wit, the following chart from the presentation booklet: Notably, BP predicts the fuel mix will also slowly shift away from fossil fuels in that timeframe. Some notable points from the presentation slides on that front: Energy consumption grows less rapidly than the global economy, with GDP growth averaging 3.5% p.a. 2012-35. As a result energy intensity, the amount of energy required per unit of GDP, declines by 36% (1.9% p.a.) between 2012 and 2035. The decline in energy intensity accelerates; the expected rate of decline post 2020 is more than double the decline rate achieved 2000-2010. Fuel shares evolve slowly. Oil’s share continues to decline, its position as the leading fuel briefly challenged by coal. Gas gains share steadily. By 2035 all the fossil fuel shares are clustering around 27%, and for the first time since the Industrial Revolution there is no single dominant fuel. Taken together, fossil fuels lose share but they are still the dominant form of energy in 2035 with a share of 81%, compared to 86% in 2012. Among non-fossil fuels, renewables (including biofuels) gain share rapidly, from around 2% today to 7% by 2035, while hydro and nuclear remain fairly flat. Renewables overtake nuclear in 2025, and by 2035 they match hydro.
Why EIA, IEA, and Randers’ 2052 Energy Forecasts are Wrong - What is correct way to model the future course of energy and the economy? There are clearly huge amounts of oil, coal, and natural gas in the ground. With different approaches, researchers can obtain vastly different indications. I will show that the real issue is most researchers are modeling the wrong limit. Most researchers assume that the limit that they should be concerned with is the amount of oil, coal, and natural gas in the ground. This is the wrong limit. While in theory we will eventually hit this limit, because of the way fossil fuels are integrated into the rest of the economy, we hit financial limits much earlier. These financial limits include lack of investment capital, inability of governments to collect enough taxes to fund their programs, and widespread debt defaults. One of the things I show in this post is that Economic Growth is a positive feedback loop that is enabled by cheap energy sources. (Economists have postulated that Economic Growth is permanent, and has no connection to energy sources.) Economic Growth turns to economic contraction as the cost of energy extraction (broadly defined) rises. It is the change in this feedback loop that leads to the financial problems mentioned above. These effects tend to lead to collapse over a period of years (perhaps 10 or 20, we really don’t know), rather than a slow decline which is easily mitigated. If, indeed, most analysts are concerned about the wrong limit, this has huge implications for energy policy:
U.S. has concerns about Iran-Russia oil-for-goods swap reports (Reuters) - The White House said on Monday it was concerned about a recent report that Iran and Russia are negotiating an oil-for-goods swap worth $1.5 billion a month, a deal a spokeswoman said could trigger U.S. sanctions. Such a deal would significantly boost Iran's oil exports, which have been slashed by more than half to about 1 million barrels a day by U.S. and European economic sanctions aimed at forcing Iran to accept curbs to its nuclear program. Russian and Iranian sources close to the barter negotiations said the deal could see Russia buy as much as 500,000 barrels a day of Iranian oil in exchange for Russian equipment and goods. "We are concerned about these reports and Secretary (of State John) Kerry directly expressed this concern with (Russian) Foreign Minister (Sergei) Lavrov today," Iran agreed on Sunday to limit its enrichment of uranium and allow more international monitoring for six months in exchange for about $7 billion in sanctions relief. The agreement with the P5+1 group of major world powers includes a pause on efforts to further reduce Iran's exports of crude oil - although it does not allow major buyers to increase their imports.
Why has Nuclear Power become so Important to Saudi Arabia?: Saudi Arabia – known for its massive oil resources – is making a serious push for a different kind of energy: Nuclear power. Last week the country signed a deal with France's AREVA and EDF on a series of initiatives aimed at supporting Saudi Arabia's nuclear energy program. Japan is also preparing a nuclear power pact with the Saudi Kingdom. The deal would allow Japanese businesses to export atomic-related infrastructure to the country, as reported by Japan Times. Saudi Arabia officially started looking into nuclear power in 2006. Along with the other members of the Gulf Cooperation Council (GCC) – Kuwait, Bahrain, the United Arab Emirates, Qatar and Oman – the oil-rich nation led an investigation into the possibility of a nuclear power and desalination program. According to the World Nuclear Association, Saudi Arabia plans on building 16 nuclear power reactors over the next 20 years, with the first scheduled to come on line in 2022.
Resource nationalism alive and well as Indonesia bans key metal exports - Indonesia has kicked off the new year with a total ban on exports of nickel, tin and bauxite, a warning that resource nationalism remains a potent force despite the commodity slump. Nickel prices jumped to a two-week high of $14,190 a tonne in London as markets brace for a 20pc loss in global supply, restricting a vital alloy for stainless steel production. Gayle Berry, from Barclays, said the ban comes at a time when industrial metals are moving towards deficit after a near-record surge of output in 2013. “If the ban remains for long, it will create a supply shock. We think that nickel looks undervalued,” she said. The drastic move comes as Africa’s oil and gas states are drawing up laws to restrict foreign companies. In South Africa, calls are growing for the nationalisation of the mining industry. Several Latin American states are tightening quotas or imposing new taxes. The willingness of populist governments to do this even after a 30-month slide in commodity prices suggests that nationalist measures may come back with a vengeance once the resource cycle picks up.
Beijing Gets Hit With First Off-The-Charts Air Pollution Day Of The Year - Beijing is starting 2014 still struggling with an old problem — off-the-charts air pollution. On Thursday, the city issued its first warning of the year for a wave of dangerous smog that exceeded the worst threshold in the warning system. Concentrations of PM2.5, a recently classified carcinogen, were 350 to 500 micrograms per cubic meter on Thursday morning. Later that afternoon, the air quality monitors at the U.S. Embassy in Beijing recorded a sickening 671. The World Health Organization (WHO) considers 25 or less micrograms per cubic meter ideal for human health. Above 300 is considered hazardous. A Beijing resident told the Guardian that he was coughing up black phlegm. He said he was planning on leaving Beijing. Another woman interviewed had donned a face mask after checking the air pollution level before leaving home. She complained of nasal inflammation and said she often worried about the health affects of the smog. In December, a first-of-its-kind clinic dedicated to treating victims of China’s smog opened its doors in Sichuan Provence, southwest China. China garnered a lot of undesired publicity in 2013 for its growing air pollution crisis. A major source is its 2,300 (and growing) dirty coal plants. Traffic-clogged city streets are also believed to play a role. In January, Beijing experienced its worst air pollution on record — levels of particulate matter topped out at 723 micrograms per cubic meter. In October, air pollution nearly shut down the entire city of Harbin, and in December, extreme air pollution forced children and the elderly in Shanghai behind closed doors and windows for at least seven days.
Beijing Citizens, Shrouded In Pollution, Flock To Giant Screens To View Artificial Sunrise - You know it's bad when...The smog has become so thick in Beijing that the city's natural light-starved masses have begun flocking to huge digital commercial television screens across the city to observe virtual sunrises. Following this week's practical shutdown of the city of "beyond index" levels of pollution, as The Mail Online reports, residents donned air masks and left their homes to watch the only place where the sun would hail over the horizon that morning...
Pollution isn’t the only thing killing tourism in Beijing - Tourism to China’s capital, home of the Forbidden City and springboard to the country’s most-visited attraction, the Great Wall, is plummeting. The overall number of tourists coming to Beijing in the first 11 months of 2013 dropped by more than 10% to 4.2 million from a year earlier, according to official figures; foreign tourist visits fell by 11%. Any drop is sure to hurt the city, which is already suffering the economic fallout of the Communist Party’s crackdown on excess spending. In 2012, over 5 million foreign tourists contributed $5.1 billion in foreign exchange revenues to Beijing’s economy, and new visa-free immigration rules for short visits passed in Dec. 2012 were expected to make tourism a “strategic pillar of the economy.” Along with the rest of China, Beijing has seen a huge buildup of luxury hotels in recent years, many of which opened for business in 2013. Beijing’s tourism commission blamed a “weak global economy,” the strong yuan and pollution for 2013′s drop, China Daily reported, and pollution in Beijing has indeed been dismal, reaching hazardous levels for huge swathes of 2013, maxing out air quality indexes in January and again at the end of December. But the 19.6% plummet in tourists from Asia excluding Hong Kong, Macau and Taiwan, suggests another factor: Heightened tensions over China’s recent attempts to assert greater influence over the East and South China Seas. Relations with Japan have been particularly dicey, and more Japanese tourists have ditched their trips to Beijing than those of any other country by far.
China car sales accelerate away from US and Brazil in 2013 - FT.com: Automakers sold 10 times more passenger cars in China than in India last year, reflecting the speed at which the world’s largest vehicle market is racing ahead of its global rivals. China car sales rose 16 per cent year-on-year to 18m units in 2013, compared with an almost 10 per cent drop in India to 1.8m units. The annual decline, reported on Thursday by the Society of Indian Automobile Manufacturers, was the first for India’s auto market in 11 years. The surprise acceleration in Chinese car sales, announced by the China Association of Automobile Manufacturers, contrasts sharply with other major markets as well. According to initial estimates, US car sales expanded 8 per cent to 15.6m vehicles last year after enjoying double-digit growth in 2012. Brazil’s car market, the world’s fourth largest, last year reported its first annual decline in a decade. “[China’s car sales] were stronger than we expected last year,” “The pace of growth in both rich and more mature provinces and less wealthy but faster growing provinces has been a surprise.” Industry analysts in India, meanwhile, expect the automotive sector’s dismal trend to continue well into 2014 as consumer sentiment and economic growth remain poor. “For 2014, the first half will continue to be weak given that the headwinds still continue to exist in terms of high interest rates and rising fuel prices,”
China Car Sales Seen Speeding Past Forecasts - The folks at China’s auto makers association are a cautious lot – at least when it comes to forecasting sales. Much like the nation’s economic planners of the past, the industry association routinely cranks out sales forecasts that turn out to be miles behind the actual total. Last year, the China Association of Automotive Manufacturers estimated industry-wide sales growth of 7%, but actual sales sped past this pedestrian pace. Sales of passenger and commercial vehicles reached 21.98 million units last year, up 14% for the fastest growth since 2010. Passenger vehicles led the way, climbing 16% to 17.93 million units.This year promises more of the same. The semi-official association set a sales growth target of 8%-10% but actual sales will almost certainly cruise comfortably ahead. Keeping expectations low and achievements high is a bit of a tradition in China. For years, the country’s economic managers set a target of 8% growth even while the economy repeatedly racked up double0digit expansion rates. More recently, actual growth has come closer to the target level. But even in a weak year like 2013, growth probably outpaced the government’s target.
Regulators at Odds on Reining In China's Shadow Lending - China's effort to rein in runaway credit is being hampered by infighting between the central bank and the nation's banking regulator, say officials at both institutions, with the two agencies sparring especially over how hard to press so-called shadow bankers. The officials say that the People's Bank of China, concerned about banks finding ways to move loans off their books, has been frustrated at what it sees as the unwillingness of the China Banking Regulatory Commission to toughen regulation of banks' dealings with shadow lenders, an array of formal and informal institutions creating credit outside the formal bank channels. The differences highlight the competing interests of the PBOC, which looks at overall financial stability, and the CBRC, which oversees the formal banking sector. Neither has clearly defined authority over shadow lending, the fastest-growing part of China's financial sector that often lends to borrowers considered too risky for traditional banks, including local governments, property developers and big companies burdened by overcapacity. Banks have taken to concocting complicated arrangements with shadow bankers to get around lending limits, making the world's No. 2 economy more dependent on debt and threatening its financial stability, Chinese and foreign economists warn.
Despite Slowdown, Employers in China Gave Bigger Raises - According to a survey by recruitment firm Hays, two-thirds of employers in China said they gave their workers raises during the last round of reviews of 6% or more—more than any other country surveyed. A majority, or 54%, of said they gave raises of between 6% and 10%, while 12% said they gave raises of more than 10%. Only 5% of employers in China said they gave no raises at all. In contrast, in Asia as a whole, just 22% of employers said they gave raises between 6% and 10%, while only 7% said they doled out more than 10%. Across the region, paltry raises were common. In Hong Kong and Singapore, the survey notes, the majority of employers gave raises between 3% and 6%. And in Japan, despite the economic stimulus measures dubbed the Abenomics in 2013, 80% of employees received raises of 3% or less. The survey featured 2,600 companies in China, Hong Kong, Japan, Singapore and Malaysia in professional sectors like sales, marketing, engineering, human resources and accountancy & finance. Chinese workers can also take heart in the fact that employers in China said they also plan to continue their generosity. For the next review, 58% of employers in China said they intend to give their staff a raise between 6%-10%, compared with less than a quarter of employers across Asia, the survey showed.
Why China Holds Upper Hand Over US in Asia for 2014 --Or so the Nikkei Asian Review believes. And the reasons for China reasserting its sphere of influence in the region are straightforward. On China's part, it has the bully pulpit in 2014 as the host of the Asia-Pacific Economic Cooperation (APEC). So, member economies' ministers--maybe even the Philippine president the PRC has put in its doghouse--will be trooping to the Middle Kingdom over the course of the year: Holding the rotating chair of the APEC forum this year, China will host a series of APEC meetings, including those of ministers in charge of trade, energy and finance, in various parts of the country starting in May. The series of APEC events will culminate in a summit of leaders in a Beijing suburb in early autumn, which will be chaired by Chinese President Xi Jinping.The APEC meetings will cover issues in a wide range of areas, including trade and investment rules and environmental and energy cooperation. By presiding over them, China will try to demonstrate its growing presence in the Asia-Pacific region. "The Xi administration sees the proposed Trans-Pacific Partnership pact, which the Obama administration is actively promoting, as part of Washington's efforts to leave China out and cement the U.S-led international order in Asia," said one source close to U.S.-China relations. This fear will probably prompt China to try to take advantage of its role as APEC chair this year to regain some of the lost ground in the competition with the U.S. for influence in the region.
Amid Fast-Track Debate, USTR Unveils Trade Dispute Action Against China -- As Congress gears up to fight over whether lawmakers should fast-track trade deals, U.S. Trade Representative Michael Froman wants to send a reassuring message: trade pact enforcement is a top priority for the White House. As a case in point, Mr. Froman unveiled his office’s latest enforcement efforts: telling China Monday USTR is preparing to take a dispute over exports of specialized steel products to the World Trade Organization’s compliance panel if Beijing doesn’t agree in the coming weeks to lower its tariffs. “To ensure that Americans see the full benefit of the rules and market access we have negotiated in our international trade agreements, the president put enforcement of America’s rights in the global trading system on a par with opening markets for U.S. exports,” Mr. Froman said. Wanting to seal a 12-country trade deal that spans some of the largest economies around the Pacific, the White House faces a challenge finding enough lawmakers on Capitol Hill to support legislation that would make it easier for the administration to ratify trade deals in Congress. Many legislators, including from his own Democratic party, are concerned free trade deals will harm businesses back home. “Today’s action shows that when the United States steps up to the plate on trade enforcement, we will follow through,” Mr. Froman said. Washington says China’s not submitting to a WTO ruling that said Beijing is wrongly applying duties on U.S. exports of a high-tech product used in power plants called grain -oriented flat-rolled electrical steel.
Seoul Affirms Interest in Joining TPP, But Says China Deal Comes First - South Korea’s Trade Ministry made clear Monday that the country will prioritize bilateral free trade negotiations with China this year over the multilateral Trans-Pacific Partnership. Inaugurating a trade promotion committee, the ministry said in a press release that the government “will first push for a South Korea-China FTA as a bridgehead for expanding presence in Chinese markets, while considering joining the Trans-Pacific Partnership.” China is not a party to talks to form the TPP, a U.S.-led free-trade bloc involving 12 countries in Asia-Pacific that together make up 40% of the global economy. The pact aims to boost growth by reducing or eliminating tariffs and establishing new rules of the road in areas as diverse as intellectual property, labor, and government’s role in private enterprise.Some analysts see the proposed bloc as a U.S. attempt to counter Beijing’s influence in the region. U.S. officials have said China and other countries are free to join the TPP if they adopt its rules.Market-oriented countries increasingly have turned to regional pacts like the TPP as efforts to reach a new, global agreement under the World Trade Organization have bogged down in recent years. Negotiators at the WTO reached an agreement last month in Bali, Indonesia, on streamlining customs procedures, but fell short of the comprehensive free-trade deal they’ve been seeking since 2001. South Korea has been a leading global advocate of free trade – its economy depends on exports, after all — but has focused more on bilateral deals, given the complexity and the glacial pace of multilateral talks. It has separate free trade pacts with the U.S., E.U., Chile, India, Peru, Singapore, the Association of Southeast Asian Nations and the European Free Trade Association.
Coalition: still looking to sell us out to the yanks - Late last year, I warned that the Federal Government seems intent to sign-up to the Trans Pacific Partnership (TPP) – the proposed regional trade deal between Pacific Rim countries, including Australia, which if it goes ahead could establish a US-style regional regulatory framework that meets the demands of its major export industries, including pharmaceutical and digital. The draft chapter on intellectual property rights, revealed by WikiLeaks, included a “Christmas wishlist” for pharmaceutical companies, including the proposal to extend patent protection and strengthen monopolies on clinical data. As part of the deal, the US is reportedly seeking patents for “new forms” of known substances, as well as on new uses on old medicines – a proposal which would lead to “evergreening”, whereby patents can be renewed continuously.It’s a huge risk to Australia’s world class public health system, which risks cost blowouts via reduced access to cheaper generic drugs and reduced rights for the government to regulate medicine prices. It also risks stifling innovation in the event that patent terms are extended too far. The US is also seeking to insert an Investor-State Dispute Settlement (ISDS) clause into the agreement, which could give authority to major corporations to challenge laws made by governments in the national interest in international courts of arbitration. The draft agreement also sought to place more restrictions on internet users by forcing ISPs to cooperate with copyright holders and terminating the accounts of repeat infringers. This is despite the High Court of Australia ruling that an ISPs inaction could not be taken as authorisation of a copyright infringement.
Australian jobs shocker in detail (in graphs) As summarized earlier, the Australian Bureau of Statistics (ABS) today released labour force data for the month of December, which registered a 0.1% seasonally-adjusted increase in the headline unemployment rate (still 5.8% due to rounding). The result was in line with analysts expectations. Total employment fell by a seasonally adjusted 22,600 jobs, with full-time jobs falling by 31,600 to 8,067,700 offset by a 9,000 increase in part-time employment to 3,561,800. However, aggregate monthly hours worked rose by 0.6 million hours to 1,634.0 million hours.The participation rate also fell sharply (-0.2%) to 64.6% to the lowest level since April 2006.
Students loan scheme blows out to $30 billion - THE cost of the university loans scheme has ballooned to more than $30 billion with some students owing over $400,000for their tuition. The most expensive students have racked up individual debts of $413,252, $313,308, $248,078, $244,198 and $200,743 under the interest-free Higher Education Loan Program (HELP), data obtained by The Daily Telegraph reveals. More than $7 billion of the soaring total debt bill - more than the gross domestic product of many small countries - is listed as "doubtful" and may never be paid back. Many of those former students owing large individual amounts are believed to have disappeared overseas, failed to complete their studies, stayed out of the workforce or have failed to reach the $51,309 salary level which triggers compulsory loan repayments. The blowout in loan costs comes as increasing numbers of students enter universities under the demand-driven system of uncapped places and a government target to have 40 per cent of all 25-to-34-year-old Australians to hold a bachelor's degree by 2025
Japan logs record current account deficit as trade balance tips (Reuters) - Japan's current account logged a record deficit in November and remained in the red for a second consecutive month as a bulging trade deficit weighed on the country's balance of payments. The 592.8 billion yen ($5.74 billion) deficit in November beat the median estimate for a 380.4 billion yen deficit as a weak yen pushed up the cost of imports. However, economists say the current account is likely to return to surplus in coming months as Japan's income balance remains strong and as an expected recovery in exports will take some pressure off the trade balance. "On top of the weak yen, we have solid domestic consumption before a sale tax hike in April, which has boosted imports," said Takeshi Minami, chief economist at Norinchukin Research Institute. "As such, Japan's current account tends to log deficits for the time being, but it will return to surplus steadily after April as the tax hike curbs domestic demand and the U.S. economy leads the global recovery." The trade deficit in November widened to 1.25 trillion yen, according to current account data released by the finance ministry on Tuesday. The income surplus stood at 900.2 billion yen, due to returns from a large selection of corporate assets and investments held overseas. The yen has fallen around 17 percent from a year ago as the Bank of Japan ramped up purchases of government debt under expanded quantitative easing to help end 15 years of mild deflation.
Japan Unveils Its Worst Current Account Deficit Ever -- Any day, month, quarter, year, decade now; Goldman Sachs' mythical J-Curve will arise from the cinder-strewn ashes of Japan's current account. Japanese bond markets are rallying and JPY is weakening modestly after Abe's increasingly disapproved-of government announced the worst balance of payments current account deficit on record. At JPY -592bn vs expectations of JPY -36bbn and its 5th miss in the last 7 months as economists and analysts and pretend portfolio managers just keep getting it wrong. The trade deficit plunged once again, missed expectations once again and printed at the 3rd worst deficit ever with the 16th monthly trade deficit in a row. But apart from that, the Nikkei is -1000 points from the 2013 close highs and apart from rumors of a big bank selling JPY to defend 103, the trend ain't Abe's friend for now...
Japan No Longer an Export Powerhouse - Higher energy imports played a role in Japan’s record current-account deficit in November. But the data is a sign of a more fundamental change: Japan’s three decades as one of the world’s biggest exporters may be over. From the 1980s until 2010 Japan exported more than it imported, supplying the world with electronics, machinery and other goods. That changed in 2011, after the Fukushima nuclear disaster. Japan’s nuclear power plants shut down, pushing up imports of other fuel and tipping the trade balance into deficit. Those reactors remain closed and Japan’s huge fuel imports, compounded by the weak yen, are widening the trade deficit. But even stripping out fuel, Japan would be running a meager trade surplus at best. A major factor is that Japanese companies have moved production offshore, to cheaper centers in China and elsewhere. Those goods show up in the export statistics from, say, China, not Japan. Japan’s ambitious monetary easing, meant to weaken the yen and lure companies back onshore, so far has failed to entice firms back. “Only a small number of companies brought back factories to Japan as the yen weakened,” Japanese exporters also are having a hard time competing with other nations, especially in the smart phone market. Japanese consumers are now increasingly buying imported goods such as electronics that were once the mainstay of the nation’s exports.
Myths and misconceptions about Japan's economy - Neojaponisme is an English-language magazine about Japanese pop culture. In the latest issue, editor W. David Marx interviews me about the various myths and misconceptions that many Westerners (and some Japanese people) have about Japan's economy. Here is the part where I lay out most of the myths:
- Myth #1: “Japan is an export-dependent country.” Actually, exports are a smaller part of Japan’s economy (16%) than that of most rich nations’ (though bigger than the U.S.). Also, Japan hasn’t had a big trade surplus for a while.
- Myth #2: “Japanese households save a lot.” This used to be true, but isn’t true anymore. The household savings rate nearly hit 0% in 2008 and is only around 2% now (America’s is around 5%).
- Myth #3: “Japan is a top-down economy guided by industrial policy.” This used to be true, but isn’t anymore. The influence of METI (formerly MITI) has been curbed substantially.
- Myth #4: “Japan is a manufacturing-based economy.” Manufacturing makes up slightly more than one-fifth of Japan’s economy, which is more than most rich countries (only Germany and Korea beat it), but is a lot less than most developing nations. India, for example, is now more manufacturing-intensive than Japan.
- Myth #5: “Japan has lifetime employment.” Sure, for the top half of the workforce. For everyone on the bottom, it’s a constant struggle with little hope of big raises or promotions. And among those with so-called “lifetime employment,” maybe half are in danger of losing their jobs to layoffs.
Japan Firms Spending Despite Looming Sales Tax - Japan’s cash-rich firms are finally starting to spend. At least that’s what economists say Thursday’s upbeat machinery orders data show. The indicator is a good predictor of business investment to come. A reading of capital expenditures is especially important in Japan, where capital spending has lagged behind the overall recovery. Even though Japan’s economy has been expanding since the fourth quarter of 2012, and firms are sitting on the most cash they’ve ever held, capital spending has only risen in one quarter since then. Companies put in Y882.6 billion in core machinery orders — everything from computers to rail cars — in November, the most for any month since July 2008. The value of core orders jumped 9.3% from October after seasonal adjustment. That was a lot higher than the 1.2% rise predicted by analysts surveyed by The Wall Street Journal and the Nikkei, even accounting for one big order in the pulp and paper industry. Though the indicator is volatile from month to month and often deviates from economists’ forecasts, the government said orders were in an upward trend in part because they had totaled over Y800 billion each month for four consecutive months through November.
Indian Slowdown Chains Millions to the Farm - India’s economic slowdown is changing the future of millions of unskilled workers, chaining them to low-wage farm work. After a sharp decline during India’s boom years, the number of people working on farms is rising again according to a report this week by Crisil Research. Between March 2005 and March 2012, the agricultural workforce fell by a whopping 37 million people as faster growth and better paying jobs in industrial and service sectors sucked workers out of the countryside. With the economy slowing over the past two years, the need for former agricultural laborers has tapered. Crisil estimates that the agricultural workforce will grow by 12 million people in the period between fiscal 2012 and fiscal 2019. That’s more people than live in India’s technology capital of Bangalore stuck in their villages in unproductive jobs.India’s industry and services sectors added 52 million jobs between fiscal 2005 and 2012. In the next seven years, around 25% fewer jobs will be created by the industrial and services sectors, Crisil said, leaving millions unable to find work outside the farm. Until recently, India was among the world’s fastest-growing economies, with gross domestic product expansion peaking at more than 10% one quarter. However, rising inflation, a prolonged period of high interest rates and a slow pace of reform have slowed expansion. Crisil expects Indian economy to grow at 6% per year during the seven years to March 2019, compared with an average of 8.5% in the previous seven years.
Has growth been good for social and religious minorities in India? Yes, Indeed - Much confusion has arisen in policy debates in India about whether or not growth has helped the poor; if yes, how much and over which time period; and whether growth is leaving certain social and religious groups behind. There remains deep skepticism on the part of NGOs and journalists that growth has been good for groups that were disadvantaged over long periods of time in the past. Arvind Panagariya and I decided to investigate these claims – see here and here. We ask simple questions relating to the evolution of poverty in the post-reform era in India. How have poverty levels changed over the last few decades? We scrutinize changes across 6 different dimensions: (1) over time, (2) across states, (3) across rural and urban regions, (4) across social groups, (5) across religious groups, and (6) using different poverty lines. We find no basis whatsoever for claims that growth in India has left disadvantaged communities behind. Poverty in India has declined between 1993-94 and 2009-10 along each one of the 6 dimensions. In fact, poverty fell for each social group (Scheduled Caste, Scheduled Tribe and Other Backward Caste) and each religious group (Hindu, Muslim, Christian, Others), in every state, in rural areas and in urban areas. The reduction in poverty has been accomplished alongside accelerating growth rates between 2004-05 and 2009-10. Importantly, and returning to the main point of contention, poverty reduction between 2004-05 and 2009-10 was larger for Scheduled Castes and Scheduled Tribes than other caste groups. Thus, the gap in poverty rates between the socially disadvantaged and upper caste groups has narrowed over time. This pattern provides clear evidence to refute the claim that reforms and growth have failed to help the socially disadvantaged or that they are leaving these groups behind. A continuation of this trend, helped along by further reforms and higher growth rates, would help eliminate the difference in poverty rates between the disadvantaged and the privileged.
Rapid Asian Growth Comes at a Cost - Emerging Asia is growing much faster than other regions, but that performance has come at a price.The region has experienced a rapid increase since the global financial crisis in the amount of capital that is required to generate output. An environment of falling productivity has arisen in which local authorities have had to plough ever-greater amounts of stimulus into their economies to support growth, amid a lack of concrete structural reforms. An International Monetary Fund working paper this week called on policymakers in emerging Asia to carry out structural reforms to improve productivity – in India, for example, by addressing skill shortages, easing labor market regulations and removing barriers to investment.China – where the government encouraged massive investment spending by local governments following the global crisis of 2007 to 2008–is a prime example of the fall in productivity. Planned reforms that aim to make domestic demand a more important driver of the economy should help address that, but will take time to show results.Thailand’s government has encouraged households to spend beyond their means to support growth, by first-time buyer schemes for cars and homes, and a pricey rice subsidy scheme – the latter causing them to badly lose market share in this important export. The fall in productivity isn’t all policy driven. Indonesia has lost competitiveness in its dominant commodities sector as a result of the depreciation of the rupiah and a fall in prices as the boom in that sector globally turns. Combined with the burden of increased leverage that has accompanied the decline in productivity – and rising bad debts in China and India – still muted global demand, and increasingly shrinking working age populations in Asia, it will take some hard work from local authorities if they want to see sustainable increases in growth ahead, Mr. Ahya said.
World Bank Sees Global Economy Picking Up — The global economy is slowly picking up steam, led by advanced economies appearing to turn the corner after five years of financial crises and recession and a continued good performance by China, the World Bank said Tuesday.However, it says growth prospects remain vulnerable to rising interest rates and potential volatility in capital flows as the U.S. Federal Reserve eases up on the extraordinary stimulus it has been providing to the U.S. economy, the world’s largest. The bank’s twice-yearly Global Economics Prospects report says global growth is expected to firm from 2.4 percent in 2013 to 3.2 percent this year and 3.4 percent in 2015. The report said the momentum that countries such as the United States and Japan are building up should support stronger growth in the developing countries.
Number of the Week: An Alternative Way of Viewing Who’s the Giant Amongst Global Manufacturers - Discussions of who’s biggest in global manufacturing almost always begin and end with the relative ranking of China and the U.S. The Middle Kingdom has grown fast and furiously for two decades, while American factories have floundered much of that time. The upshot: China displaced the U.S. as No 1 in 2010 and now accounts for over 22% of the world’s manufacturing, as measured by value-added, according to United Nations data. Value-added in manufacturing is the sum of the value produced at each stage of production and avoids double-counting that value as a product moves through production chains. But looked at relative to the size of each country’s population, the picture is very different. Daniel J. Mecksroth, an economist at the Manufacturers Alliance for Productivity and Innovation, a think tank in Arlington, Va., wrote a recent note that explored these different measures. He notes that since China has four times more people than the U.S., the value-added of its manufacturing sector is relatively low. Indeed, measured this way, China drops dramatically in world rankings—to 10th place, with a value-added per capita of only $1,856. The top slots go to Japan, Germany, and South Korea, with the U.S. coming in at No 4. For purposes of these comparisons, he omits Switzerland and Sweden, which have extremely high per capita value-added in manufacturing, but which are also so very small producers in absolute terms.
Income gap poses biggest threat to global community, warns WEF - The large and growing income gap between rich and poor is the biggest risk to the global community in the next decade, the World Economic Forum said on Thursday as politicians, business leaders and academics prepared to gather in Davos. Reflecting mounting concern about the risk to societies from inequality, the WEF said the need to tackle disparities in income and wealth had to be addressed at WEF's annual gathering in the Swiss ski resort of Davos next week. The WEF said its annual survey of 700 opinion formers had identified the income gap, extreme weather events and unemployment or underemployment as the three threats most likely to cause major cross-border damage in the next 10 years. It added that a fresh fiscal crisis, climate change and water shortages were the three risks that would have the biggest impact on the global community, although these were seen as less likely. Jennifer Blanke, the WEF's chief economist, said that although incomes gap between countries had been narrowing, the gulf between rich and poor had widened within countries. "The message from the Arab spring, and from countries such as Brazil and South Africa is that people are not going to stand for it any more."
Baltic Dry Continues Collapse - Worst Slide Since Financial Crisis -- Despite 'blaming' the drop in the cost of dry bulk shipping on Colombian coal restrictions, it seems increasingly clear that the 40% collapse in the Baltic Dry Index since the start of the year is more than just that. While this is the worst start to a year in over 30 years, the scale of this meltdown is only matched by the total devastation that occurred in Q3 2008. Of course, the mainstream media will continue to ignore this dour index until it decides to rise once again, but for now, 9 days in a row of plunging prices is yet another canary in the global trade coalmine and suggests what inventory stacking that occurred in Q3/4 2013 is anything but sustained. Baltic Dry costs are the lowest in 4 months, down 40% for the start of the year, and the worst start to a year in over 30 years...
U.S. Monetary Policy and Its Effects on Latin America - IMF Blog - Some basic realities seem to be getting lost in the debate over the Fed’s “exit” from unconventional monetary policy and its impact on Latin America.First, the still-loose stance makes sense. U.S. inflation is too low, the output gap too large, and the labor market too weak. And even during tapering, the Fed’s stance will remain highly loose. The 10-year Treasury rate, adjusted for core inflation, is about 230 basis points below its 30-year average and the inflation-adjusted Fed funds rate is 320 basis points below. These rates are likely to remain below their 30-year average for at least the next two to three years.Second, these loose monetary conditions have tangible benefits for Latin America. A stance that supports growth and financial stability in the world’s largest economy is good for the region, given its links to the United States. In turn, continued U.S. growth is positive for commodities demand, both directly from the U.S. and via other countries that benefit from U.S. growth. And finally, international financing conditions remain very favorable for Latin America—the average yield on sovereign debt is still about 250 basis points below its 16-year average. These conditions have allowed governments and business to refinance their liabilities and finance infrastructure and other investment at historically low rates. Moreover, several countries have been able to issue for the first time in international markets
Sharks circle Canadian housing - December’s house price results, released yesterday by Teranet, revealed that Canadian house values rose marginally over the month (+0.1%) to a new record high, with prices also up 3.8% over the year and 30% above their April 2009 trough: In real terms, Canadian house prices also hit a new peak, with prices 21% above their April 2009 trough: Price performance across the major markets was mixed, however, with solid growth recorded in Vancouver (+0.6%) and Toronto (+0.4%), whereas values in Montreal fell by 0.6%. Price momentum is also strong in Vancouver, whereas Montreal is weakening (see next chart). For a number of years now, Canada’s housing market has been the strongest performing developed market, which has also made it the world’s most overvalued according to the Economist, the OECD, and Deusche Bank (see below table). Household debt in Canada also continues to rise, recently hitting an all-time high of 164% of disposable incomes, which raises the risk of a disorderly unwind. Meanwhile, unemployment has also worsened, increasing by 0.3% to stand at 7.2% as at December (see next chart). With risks clearly building, hedge funds are now circling the Canadian housing market. But the market has looked dangerously overvalued for years and there’s no telling when the market will follow its southern neighbour into decline, if at all.
Europe: On the road to double-dip recession or deflation? - The Economist - There is a tug‐of‐war between the euro zone and emerging markets (EMs). As American output and interest rates rise, capital outflows in one or both regions are likely to rise. What form these outflows will take, which region will suffer more, depends on each region’s financial vulnerabilities, and how their politicians are expected to operate under duress. That is, in my view, the main game that is being played now in capital markets. It resembles a tug‐of‐war because the effect of American economic recovery may greatly depend on the relative strengths of these regions. The shock coming from America may not be large for the euro zone‐EM combined, but a slight weakening of a region or sub‐region may tilt the balance sharply in the opposite direction. Let me elaborate a little bit. If the balance tilts against the euro zone, investors will shift the composition of their portfolios and deteriorate its credit channel. Whether or not this triggers deflation of euro-zone prices depends on the role of euro‐denominated assets for collateral and in facilitating commercial transactions. Typically, when EMs are faced with an episode of similar characteristics, there is a portfolio shift in favour of foreign‐exchange-denominated assets triggering maxi‐devaluations and inflation. However, the euro area is a large currency zone where the euro is well-established as a unit of account, and a central bank which is strongly averse to inflation; therefore, the “flight to quality” may produce opposite effects, namely, strengthening of the euro and price deflation. This will be a kiss of death for the euro-zone real sector because, to the weaker competitive conditions triggered by currency appreciation, price deflation may add two lethal factors: (1) debt deflation (i.e., increase in the real value of the debt not indexed to prices, as was pointed out long ago by Irving Fisher), and (2) the expectation that prices will continue falling. Factor (1) further dries up credit flows, while factor (2) increases the real return of cash balances and, hence, lowers aggregate demand.
48.6% of Spaniards Aged 18-24 Would Take Any Job, Anywhere, for Low Wages; Ikea Spain Gets 100,000 Applicants for 400 Jobs - Almost half of young Spaniards accept any job, anywhere, despite low salary: 48.6% of Spaniards aged 18 to 24 said they would accept any job, anywhere and even with a low income. 84.9% felt very or fairly likely to have to work on what is available, 61.7% considered it equally likely to have to go abroad, and 79.2% said they need to study more. Despite this, an overwhelming majority (80%) are convinced that, at least in the near future, will have to be financially dependent on their family. Young Spaniards recognize enjoy the benefits of the welfare state far more than their parents, except as regards stability and security. They are also convinced that their children will live much worse than them. Only 20% of young people believe things will improve in the next two or three years, compared to 36% who think it will get worse. Moreover, nearly three in four young people (71%) considered likely to find little or no work in the coming year. Also via translation from El Economista, please consider Ikea Spain Gets 100,000 Applicants for 400 Jobs The Swedish multinational Ikea will have work to select staff for a store in Valencia because 100,000 people submitted applications to fill 400 jobs. Ikea received a total of 100,000 job applications through a web page offering. In the first 48 hours of processing, Ikea received 20,000 applications. The store, which will open in summer, will have a staff of 400 employees and also generate about 80 indirect jobs to cover services such as security, transport and cleaning, among others.
Spanish Lending Rates Soar To Highest Since 2008 - Despite sovereign bond yields plumbing new record lows and the Prime Minister proclaiming (against Draghi's advice) that the nation has turned the corner and is out of the crisis; Spain's record unemployment and record loan delinquency is showing up in a major credit-creation-crushing way for small businesses. As Bloomberg's Jonathan Tyce reports, Spanish new business lending rates just experienced the largest 2-month surge in over a decade to their highest since 2008. At 4.04%, new business loans trade over 300bps above two-year sovereign debt (and are diverging) as the efforts of Europe's 'whatever it takes' central bank are being entirely wasted in terms of reaching the Keynesian growth-driving economy. We suspect this surge will once again raise talk of a rate-cut (and expose the impotence of the ECB's transmission mechanisms).
Delinquencies and Defaults in Spain Hit 13%, a 50-Year Record Looking for evidence of a recovery in Spain? So am I, but I sure don't see any. Via translation from La Vanguardia, please consider Bank Defaults Hit Record 13% in November. Delinquency ratio of banks, savings banks, cooperatives and credit institutions operating in Spain rose again in November to 13.08%, a level not seen since the data began to be collected, over 50 years.According to provisional data for November released today by the Bank of Spain, the Spanish financial system stand together a volume of overdue loans of 192.504 billion euros, compared to 190.971 billion in October, largely due to the economic crisis and high unemployment. Compared to November 2012 the total volume of loans in November declined by nearly 212 billion, due in large part to deleveraging holding families and Spanish companies. Although the Bank of Spain does not break default rates by type of institutions with the exception of the EFC, the rest (banks, savings banks and cooperatives) recorded a volume of bad loans of 187.039 billion euros, compared to 185.439 billion of previous month.
Catalonia defies Madrid with push for independence vote (Reuters) – Local lawmakers in the north-eastern Spanish region of Catalonia voted to seek a referendum on breaking away from Spain on Thursday, setting themselves up for a battle with an implacably opposed central government in Madrid. The Catalan Parliament in Barcelona voted 87 to 43, with 3 abstentions, to send a petition to the national parliament seeking the power to call a popular vote on the region’s future. The independence movement in Catalonia, which has its own language and represents a fifth of Spain’s national economy, is a direct challenge to Prime Minister Mariano Rajoy, who has pledged to block a referendum on constitutional grounds. Independence for the region, which already has significant self-governing powers, is thus considered a remote possibility, but Catalan President Artur Mas is buoyed by a groundswell of public support to defy Madrid with plans for a referendum. Polls show roughly half of Catalans want independence, but as many as 80 percent want the right to vote on the matter. Pro-independence leaders in Catalonia say Rajoy should follow the example of British Prime Minister David Cameron, whose government opposes Scottish independence, but is allowing the Scots to decide in a vote later this year.
Eurozone industrial production jumps more-than-expected - A surge in Eurozone industrial production, which rose at the fastest pace in three-and-half years, raised confidence on Tuesday that the region's economy will likely have expanded for a third straight quarter in the home straight of the year. Specifically, data from Eurostat showed on Tuesday that industrial output in November rose 1.8% month-on-month and 3% on the year. This was the largest surge since May 2010 and August 2011, respectively, and easily beat consensus expectations for a 1.4% increase in both figures. On another positive note, October's data was also revised upwards, with the monthly rate of expansion increasing to 0.5% from the prior 0.2% and the yearly pace of contraction moderating to a fall of 0.8% from the initial rate of decline of 1.1%. Although most subindices registered growth, an annual drop of 0.8% in November durable consumer goods might suggest continued weakness in household confidence as unemployment for the area remains at record highs.
Success, European Style - Paul Krugman - Since I’m in Ireland, I should give a belated plug to the very good piece by Fintan O’Toole debunking talk about Irish recovery. It’s kind of amazing, really. Here’s what Ireland’s recovery — both what has happened so far, and what’s likely over the next two years — looks like, according to the European Commission itself: It takes an almost heroic act of denial to look at this chart and see a success story, a vindication for austerity policies. And for what it’s worth (which isn’t much), Dublin still looks like a depressed city, with a lot of vacant storefronts — although my impressions may be colored by what I know about the macro numbers. Also, hotel rooms are remarkably cheap — good for visitors, but a sign that business remains very slack. It’s really quite awesome, then, how the slight uptick here and in a few other places is being greeted by the likes of Olli Rehn with victory dances.
France Collective Depression; Growing Demand for Protection from Immigrants; Only 35% Think EU is Good for France - Les Echos reports "the distrust of politics has never been so high in France. This is one of the great lessons of the latest CEVIPOF annual poll". Distrust of politics is extremely high everywhere, but at least the US is not in a depression. Via translation, please consider The French fall into a "collective depression" The situation was already not good. And it gets worse again. For the first time since 2009 - the date of creation of the barometer, "gloom" has a relative majority of 34%, up 9 points. Three-quarters of French youth believe their chances of success of are less than their parents.60% of French - an increase of 5 points over one year - believe their financial situation will worsen over the next twelve months.Unions are in the barometer of CEVIPOF, with only 28% of French having confidence. This is a fall of 7 points in a year.Hardening of values is found by the barometer ("there are too many immigrants") with for 67% in agreement.47% of respondents - a jump of 17 points since 2009 - say France need "more protection". Only 23% want France to open more. Only 35% of French believe that belonging to the European Union is a good thing for France, a drop of 17 points since October 2011. 87% of respondents believe that politicians care little or nothing of their opinions (+6 points). 69% - an increase of 21 points - believe that democracy does not work.
Francois Hollande vows ‘supply-side’ assault on French state, doubles down on EMU austerity agenda -- French leader Francois Hollande stuns left-wing of his own Socialist Party by calling for a new economic strategy based on “supply-side” policies. French president François Hollande has vowed an “electro-shock” to lift the French economy out of deep slump, promising to shrink the elephantine state and push through a raft of pro-business reforms. The embattled French leader stunned the left-wing of his own Socialist Party by calling for a new economic strategy based on “supply-side” policies, accompanied by €30bn of fresh spending cuts by 2017 to pave the way for lower taxes and charges on companies. The shift has been widely compared with Tony Blair's New Labour policies and the reform drive by German Chancellor Gerhard Schröder in 2004, though Mr Hollande vehemently denied any infection from market “liberalism” in a televised press conference. “I was elected with the help of the Left and a I remain a Socialist,” he said, adding that it was possible to preserve the French welfare model by learning from the Nordic states. In reality the Scandinavians have been chipping away at benefits. Mr Hollande's plan is based on a “responsibility pact” with the employers federation Medef. The group’s chief, Pierre Gattaz, said he is willing to “play ball”, praising Mr Hollande for a genuine shift in strategy after 18 months of half-measures, false-starts and back-sliding. Medef has pledged 1m jobs by 2020 in exchange for a shake-up of labour laws and a €100bn cut in labour costs over five years, split between tax cuts and lower social security contributions.
France's Hollande Sees Approval Ratings Jump After Affair With An Actress - Having tumbled to record lows - amid a crumbling economy, soaring unemployment, and staggering taxation - it would appear French President Francois Hollande has figured out how to raise his approval rating. As Bloomberg reports, the Socialist president’s approval rating jumped 2 points to 26 percent, according to an LH2 poll, after a magazine reported that he’s having an affair with actress Julie Gayet. While Hollande "deeeply deplored" this intrusion into his private life, we suspect we won't mind so much now that the poll numbers are out. This 'affair' strategy backfired for Clinton but may just be what Obama and Abe need... Having fallen non-stop for a year, the first poll post-"Affair" has seen Hollande's apprval jump...
Scandal in France, by Paul Krugman - François Hollande, the president of France, has done something truly scandalous. I am not, of course, talking about his alleged affair... No, what’s shocking is his embrace of discredited right-wing economic doctrines. It’s a reminder that Europe’s ongoing economic woes can’t be attributed solely to the bad ideas of the right. Yes, callous, wrongheaded conservatives have been driving policy, but they have been abetted and enabled by spineless, muddleheaded politicians on the moderate left. In this depressed and depressing landscape, France isn’t an especially bad performer. It’s true that the latest data show France failing to share in Europe’s general uptick. Most observers ... attribute this recent weakness largely to austerity policies. But now Mr. Hollande has spoken up about his plans to change France’s course — and it’s hard not to feel a sense of despair.For Mr. Hollande, in announcing his intention to reduce taxes on businesses while cutting (unspecified) spending to offset the cost, declared, “It is upon supply that we need to act,” and he further declared that “supply actually creates demand.” That echoes, almost verbatim, the long-debunked fallacy known as Say’s Law — the claim that overall shortfalls in demand can’t happen, because people have to spend their income on something. This just isn’t true... All the evidence says that France is awash in productive resources, both labor and capital, that are sitting idle because demand is inadequate.
Massive pile of poop dumped outside the French National Assembly - A truck dumped a huge pile of manure outside France’s National Assembly on Thursday in a protest against the French political elite. The driver of the truck — which was marked with the slogan “Out with Hollande and the whole political class!” — was apprehended by police shortly after releasing his smelly load outside the front gates of the grand Palais Bourbon that hosts the lower house Assembly. He was taken to a nearby police station and expected to face charges.
Debunking the Idea that “Structural Reforms” Reduce Unemployment - There is little doubt that the “fiscal compact,” which has replaced the Stability and Growth Pact of the Economic and Monetary Union, reinforces an already-established neoliberal perspective on macroeconomic policy—with the emphasis on balanced budgets and an “independent” central bank only concerned with price stability (the latter to be achieved through interest-rate manipulation). There had long been calls from institutions such as the European Central Bank (ECB) for “structural reforms,” “liberalisation,” etc., alongside fiscal consolidation. “Structural reforms” are usually interpreted as a euphemism for deregulation, reduction of union rights, etc. The term is not actually defined within the Treaty. However, there can be little doubt as to its meaning. For example, Mario Draghi, President of the ECB, stated that the needed reform of the labour market “takes different shapes in different countries. In some of them one has to make labour markets more flexible and also fairer than they are today. In these countries there is a dual labour market: highly flexible for the young part of the population where labour contracts are three-month, six-month contracts that may be renewed for years. The same labour market is highly inflexible for the protected part of the population where salaries follow seniority rather than productivity.” The European Commission President, José Manuel Barroso, argued that the European Union member states “should now intensify their efforts on structural reforms for competitiveness.” He specifically highlighted the need for comprehensive labour market reforms as “the best way to kickstart job creation”
Nigel Farage Booms "Europe Is Now Run By Big Banks, Big Business, And Big Bureaucrats" - With Greek Prime Minister Antonis Samaras settling into his role as EU President, UKIP's Nigel Farage stunned the "Goldman Sachs puppet" with a 150-second tirade of truthiness he has likely never experienced. Farage sarcastically remarks how Greeks "will be dancing in the streets" at Samaras' 'successful' negotiation on MiFiD reminding him that "60% of youth are unemployed and the neo-nazi party are on the march." Europe is now run by "big business, big banks, and big bureaucrats," Farage goes on, suggesting the smarmy-looking Samaras should "rename his party from New Democracy to No Democracy." People do not want a United State of Europe, the outspoken UKIP leader explains, they want a "Europe of sovereign states," and concludes ominously, "the European elections will be a watershed."
George Osborne lays down ultimatum: reform EU or Britain quits - George Osborne will today deliver a stark warning to Britain's European partners that the UK will leave the EU unless it embarks on whole-scale economic and political reform. The chancellor's comments come as the Tory leadership tries to regain the initiative on Europe, after 95 MPs signed a letter calling for the dismantling of the core principles of the EU. In a speech to a conference organised by the pro-reform Open Europe thinktank and the Fresh Start group of Tory MPs, Osborne will say: "There is a simple choice for Europe: reform or decline. Our determination is clear: to deliver the reform, and then let the people decide." Tory backbencher Bernard Jenkin won the support of about 100 MPs for a letter to David Cameron calling for the British parliament to be given a veto over all EU laws. Such a move would dismantle the rules of the European single market which were drawn up by Margaret Thatcher's ally, Lord Cockfield, to prevent France imposing protectionist measures by denying member states a national veto. Osborne will make clear that Cameron will push for wide-ranging reforms if he wins the general election next year with a mandate to renegotiate the terms of British membership. Osborne will tell the conference: "The biggest economic risk facing Europe doesn't come from those who want reform and renegotiation – it comes from a failure to reform and renegotiate. "It is the status quo which condemns the people of Europe to an ongoing economic crisis and continuing decline."
Your Humble Blogger Speaks on BBC Radio About Why Bankers Make So Much Money - Yves Smith - I very much enjoyed this chat on why bankers are able to extract such extortionate pay so much and hope you do as well (as in the talk, not the underlying fact set). http://downloads.bbc.co.uk/podcasts/worldservice/bizdaily/bizdaily_20140102-0830a.mp3 We’re a bit late in posting this interview because the BBC does not make it easy to embed their broadcasts. However, it turns out to be timely since it was revealed yesterday that the average pay for Goldman’s 32,900 employees for 2013 was $383,000. Should you have technical difficulties, please try this link for the segment on Business Daily, or try this one for the podcast proper.


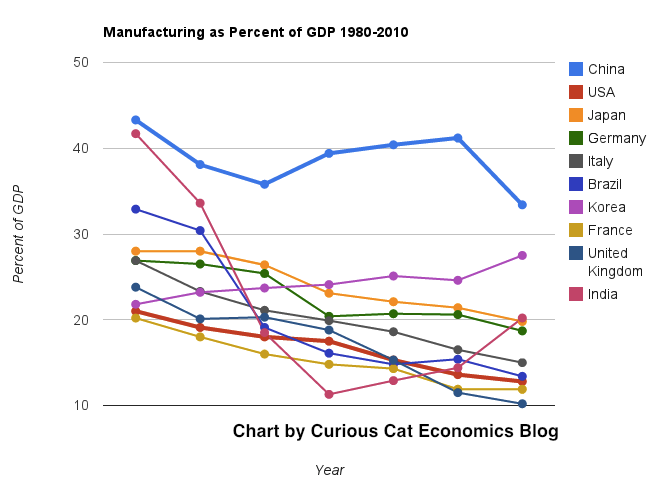
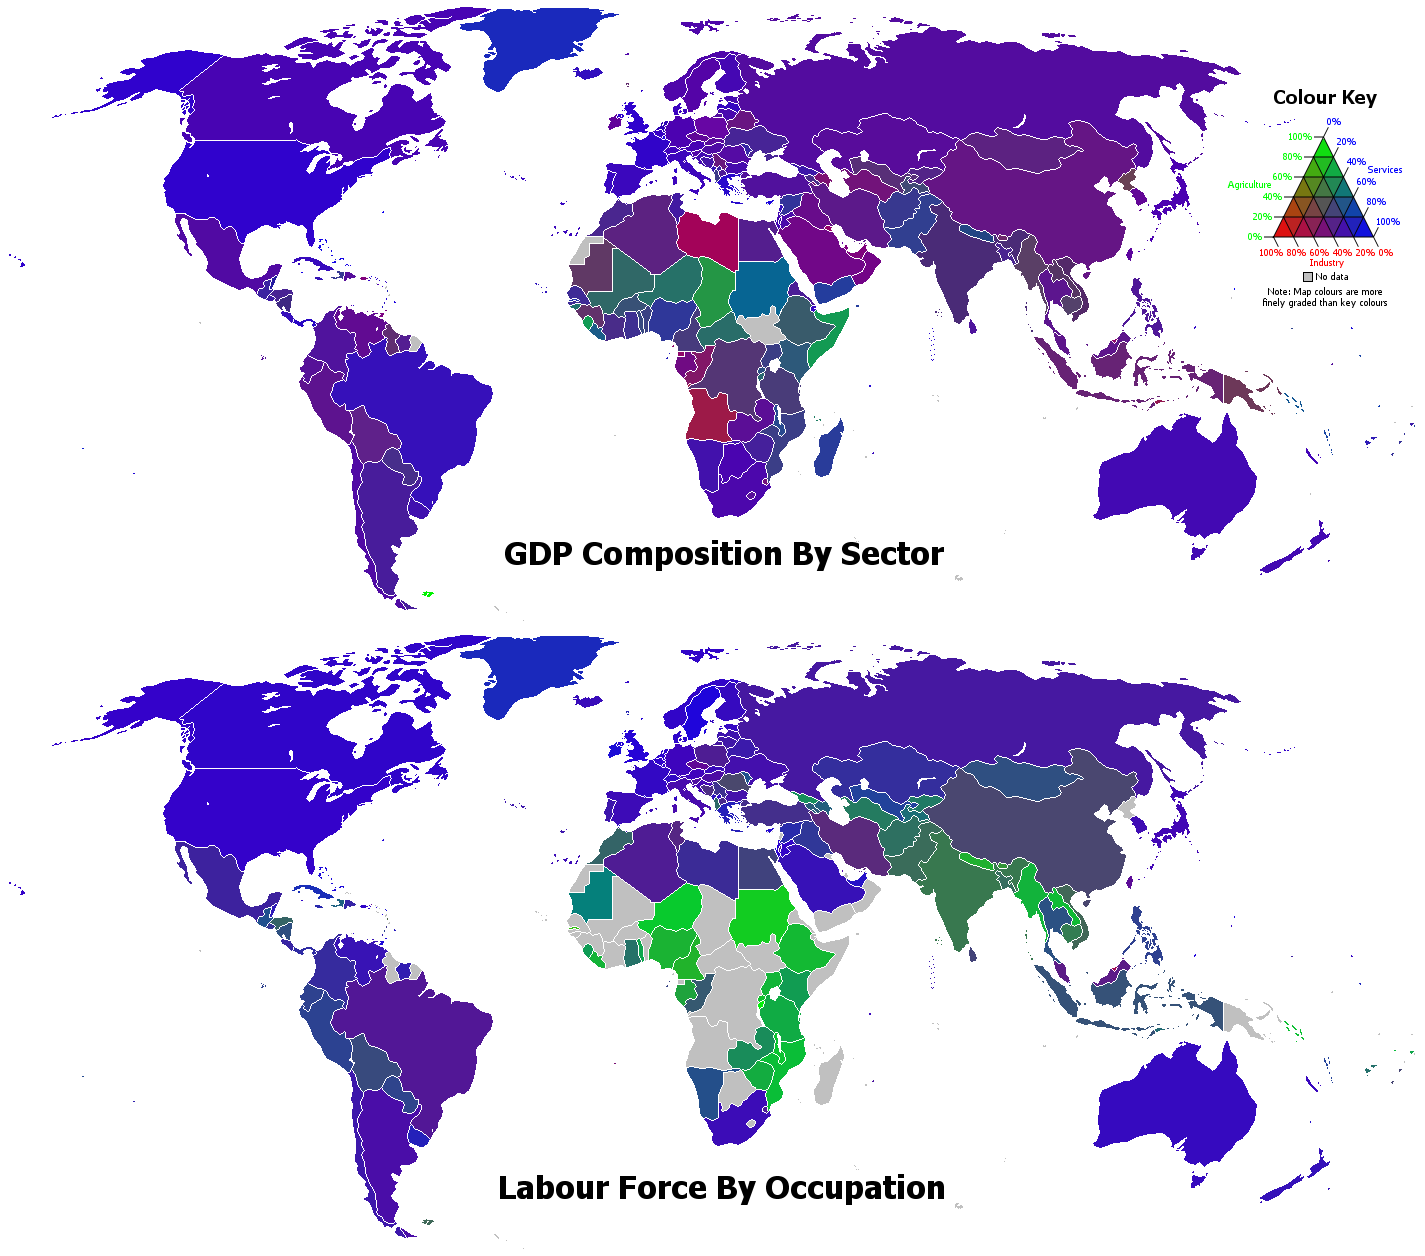
No comments:
Post a Comment